. 2025 Jun;38(6):e70046.
doi: 10.1002/nbm.70046.

Maximizing NMR Sensitivity: A Guide to Receiver Gain Adjustment

Affiliations

Maximizing NMR Sensitivity: A Guide to Receiver Gain Adjustment

Josh P Peters et al. NMR Biomed. 2025 Jun.

Abstract

Novel methods and technology drive the rapid advances of nuclear magnetic resonance (NMR). The primary objective of developing novel hardware is to improve sensitivity and reliability (and possibly reduce cost). Automation has made NMR much more convenient, but it may lead to trusting the algorithms without regular checks. In this contribution, we analyzed the signal and signal-to-noise ratio (SNR) as a function of the receiver gain (RG) for 1H, 2H, 13C, and 15N nuclei on five spectrometers. On a 1 T benchtop spectrometer (Spinsolve, Magritek), the SNR showed the expected increase as a function of RG. Still, the 1H and 13C signal amplitudes deviated by up to 50% from supposedly RG-independent signal intensities. On 7, 9.4, 11.7, and 14.1 T spectrometers (Avance Neo, Bruker), the signal intensity increases linearly with RG as expected, but surprisingly, a drastic drop of SNR is observed for some X-nuclei and fields. For example, while RG = 18 provided a 13C SNR similar to that at a maximum RG of 101 at 9.4 T, at RG = 20.2, the determined SNR was 32% lower. The SNR figures are strongly system and resonance frequency dependent. Our findings suggest that NMR users should test the specific spectrometer behavior to obtain optimum SNR for their experiments, as automatic RG adjustment does not account for the observed SNR characteristics. In addition, we provide a method to estimate optimal settings for thermally and hyperpolarized samples of a chosen concentration, polarization, and flip angle, which provide a high SNR and avoid ADC-overflow artefacts.


Figures

FIGURE 1
FIGURE 1
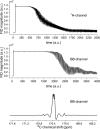
Magnitude 1H (top) and 13C (middle) free induction decays (FID) of a thermally polarized water sample and hyperpolarized [1‐13C]pyruvate (99 mM), and spectrum of the latter (bottom). The signals above ~1.3 × 10⁹ a.u. were recorded incorrectly; the receiver range threshold (RRT) value causes severe distortions in the spectrum (bottom). A reliable signal quantification is not possible in this case. Signal plotted as recorded by a standard NMR spectrometer in the rotation frame of the excitation pulse; oscillations are caused by off‐resonance excitation.
FIGURE 2
FIGURE 2
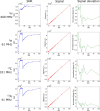
SNR (left), signal (middle), and deviation of the signal from signal (RG = 101)/101 (right) for 1H, 2H, 13C, and 15N reference samples as a function of RG at 9.4 T at 90° excitation. The signal was found to increase linearly with RG, as expected, for all nuclei (middle). The relative deviation of the signal (RG)/RG to signal (RG = 101)/101 (right) showed larger variations for RGs below 20, and larger deviations for 13C, 15N than for 1H and 2H. The SNR approached a maximum value asymptotically, as expected, but showed an unexpected, abrupt drop at RG 18 for all nuclei but 1H. After the drop, the SNR increased again asymptotically but slower than before.
FIGURE 3
FIGURE 3
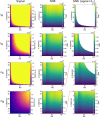
Calculated 9.4 T NMR signals (left) and SNR, including (center) and excluding (right) parameters where clipping is expected, as a function of excitation angle α and RG for H2O (111.02 M 1 H) and D2O (110.42 M 2 H), both thermally polarized, or 90 mM, 35% hyperpolarized 13 C and 40 mM, 15% hyperpolarized 15 N. Note the continuous, monotonous variation of the signal, and the discrete jumps for X‐nuclei SNR. Signals exceeding the maximum detectable signal Sm were removed from the right column. The data was calculated using Equation (5). The following parameters were used in simulations, which should reflect possible experimental conditions: (1H) a pure H2O sample at thermal polarization was assumed with [H2O] = 55.51 M, (2H) a pure D2O sample with [D2O] = 55.21 M, (13C) a 90 mM 13C with 35% polarization, and (15N) a 40 mM 15N with 15% polarization. The maps were calculated by extrapolating signal (RG) and SNR (RG) reference maps (Figure 2) for missing RG values between 0.25 and 101. Maximum flip angle was limited to 5° (13C) and 10° (15N) to mimic experimental conditions following hyperpolarization. Values when signal>Sm were removed from the SNR maps (third column, white areas), leaving behind only allowed (signal<Sm, when ADC is not overflown) combinations of α and RG.
FIGURE 4
FIGURE 4
13C NMR integrals (black) and SNR (red) of hyperpolarized [1‐13C]pyruvate acquired 46 consecutive spectra after α = 5° excitations with alternating RG (0.25 ‐ triangles, 18 ‐ circles). The integrals of RG 0.25 were multiplied by calibrated factor 66.33 (Figure 2) to bring it to the same level as the signal obtained with RG 18. Both signal and SNR were found to decay monotonously, as if measured with the same RG. The SNR was about 5 times higher for RG 18 than RG 0.25, similar to the results of the calibration experiments (factor 4.8). The repetition time was 7 to 10 s because of compilation delays in the console.
FIGURE 5
FIGURE 5
13C SNR graphs at different field strengths of 7 (A), 9.4 (B), 11.7 (C), and 14.1 T (D) Bruker systems with Avance NEO console. At 7 and 9.4 T, a steep increase up to RG 16 and 18, respectively, can be observed, with a drop and prolonged recovery of SNR thereafter. At 11.7 T, the SNR increases rapidly up to about RG 10 and plateaus thereafter. At 14.1 T, the SNR increases more rapidly at lower RG values up to RG 36 and keeps increasing monotonously until the maximum RG of 101 is reached. At the two lower field systems, the carbon‐13 resonance frequency is below 101.25 MHz—the threshold value for the observed effect.
FIGURE 6
FIGURE 6
15N SNR graphs at different field strengths of 7 (A), 9.4 (B), 11.7 (C), and 14.1 T (D) Bruker systems with Avance NEO console. Similar to 13C, at 7 and 9.4 T, a steep increase up to RG 16 and 18, respectively, can be observed, with a drop of SNR and a prolonged recovery of SNR thereafter. At 11.7 T, the SNR increases rapidly up to about RG 4, drops by about 70%, and recovers thereafter. At 14.1 T, the SNR increases monotonously up to RG 28.5 and drops by about 23%, the SNR recovers until the maximum RG of 101 is reached. At all systems, the nitrogen‐15 resonance frequency is below 101.25 MHz—the threshold value for the observed effect.
FIGURE 7
FIGURE 7
1H (top) and 13C (bottom) high‐resolution NMR signals (left) and SNR (right) as a function of receiver gain acquired with a 90° excitation on a 1 T benchtop NMR spectrometer using the reference samples. The 1H and 13C signals showed a slight but steady increase with RG (e.g., 50% signal increase for 1H). Note that the spectrometer is supposed to correct for RG automatically (the signal should be constant). However, the signal varied markedly, e.g., for high RG. The SNR increased slowly for RG <≈ 0, then rapidly for RG ≈ 0–25, and leveled thereafter. The 13C SNR of about 1 for RG below ~ 0 dB is insufficient for reliable analysis.

Similar articles

References

    1. Sapir G., Steinberg D. J., Aqeilan R. I., and Katz‐Brull R., “Real‐Time Non‐Invasive and Direct Determination of Lactate Dehydrogenase Activity in Cerebral Organoids—A New Method to Characterize the Metabolism of Brain Organoids?,” Pharmaceuticals 14, no. 9 (2021): 878, 10.3390/ph14090878. - DOI - PMC - PubMed
    1. Sharma R. and Sharma A., “21.1 Tesla Magnetic Resonance Imaging Apparatus and Image Interpretation: First Report of a Scientific Advancement,” Recent Patents on Medical Imaging 1, no. 2 (2011): 89–105.
    1. Kovacs H., Moskau D., and Spraul M., “Cryogenically Cooled Probes—A Leap in NMR Technology,” Progress in Nuclear Magnetic Resonance Spectroscopy 46, no. 2 (2005): 131–155, 10.1016/j.pnmrs.2005.03.001. - DOI
    1. Hövener J., Pravdivtsev A. N., Kidd B., et al., “Parahydrogen‐Based Hyperpolarization for Biomedicine,” Angewandte Chemie, International Edition 57, no. 35 (2018): 11140–11162, 10.1002/anie.201711842. - DOI - PMC - PubMed
    1. Ardenkjaer‐Larsen J. H., Fridlund B., Gram A., et al., “Increase in Signal‐to‐Noise Ratio of > 10,000 Times in Liquid‐State NMR,” Proceedings of the National Academy of Sciences 100, no. 18 (2003): 10158–10163, 10.1073/pnas.1733835100. - DOI - PMC - PubMed

MeSH terms

LinkOut - more resources