. 2025 May;21(5):e70170.
doi: 10.1002/alz.70170.

Multimodal spatial gradients to explain regional susceptibility to fibrillar tau in Alzheimer's disease

Affiliations

Multimodal spatial gradients to explain regional susceptibility to fibrillar tau in Alzheimer's disease

Ying Luan et al. Alzheimers Dement. 2025 May.

Abstract

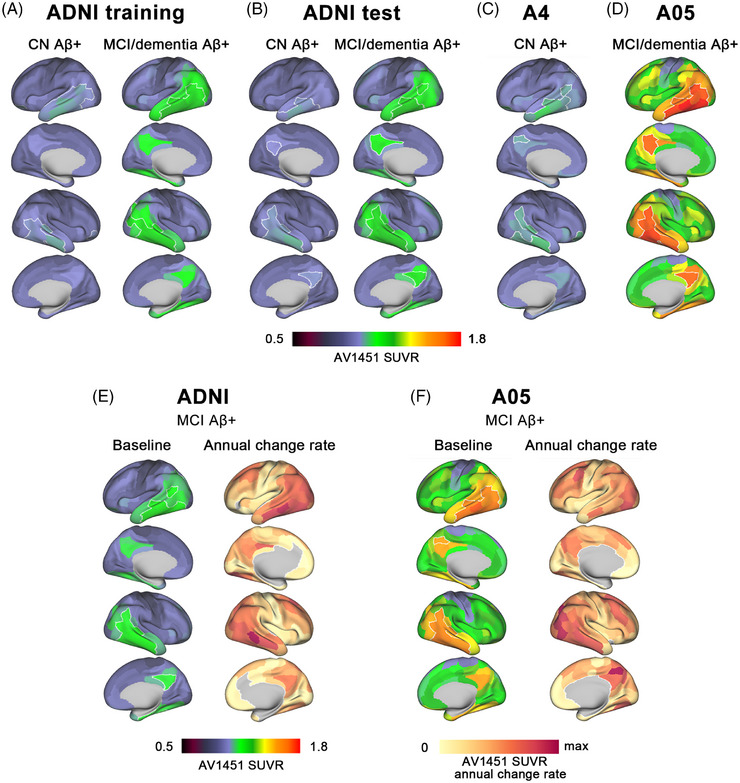
Introduction: In Alzheimer's disease (AD), fibrillar tau gradually progresses from initial seed to larger brain area. However, those brain properties underlying the region-dependent susceptibility to tau accumulation remain unclear.

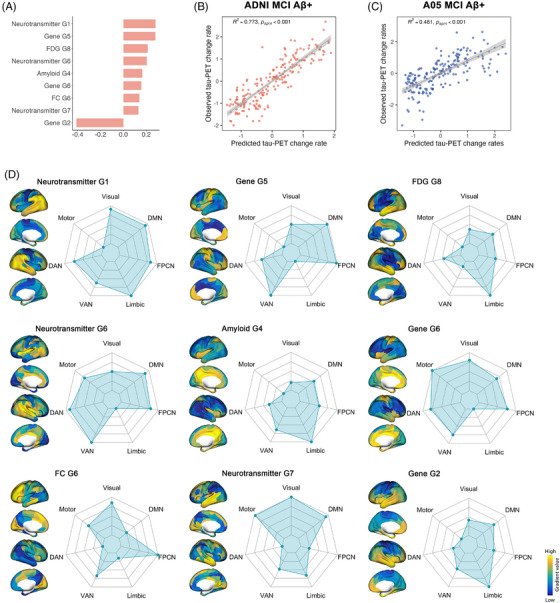
Methods: We constructed multimodal spatial gradients to characterize molecular properties and connectomic architecture. A predictive model for regional tau deposition was developed by integrating embeddings in the principal gradients of global connectome gradients with gene expression, neurotransmitters, myelin, and amyloid-beta. The model was trained on amyloid-beta-positive participants from Alzheimer's Disease Neuroimaging Initiative (ADNI) and externally validated in independent datasets.

Results: The combination of gradients explained up to 77.7% of cross-sectional and 77.3% of longitudinal inter-regional variance of tau deposition. Gene set enrichment analysis of a major gene expression gradient points to synaptic transmission to confer increased susceptibility to tau.

Discussion: Our findings reveal a spatially heterogeneous molecular landscape shaping regional susceptibility to tau deposition, presenting a powerful system-level explanatory model of tau pathology in AD.

Highlights: Spatial gradients of fundamental molecular brain properties associated with tau pathology. The explanatory power showed high consistency across studies. Genetic analyses suggested that synapse expression plays a vital role in tau accumulation.

Keywords: Alzheimer's disease; functional connectivity; gene expression; multimodal gradients; neurotransmitters; predictive model; tau positron emission tomography.


Conflict of interest statement

M.E. and N.F. receive research funding from Eli Lilly. All other authors reported no conflict of interest. Author disclosures are available in the Supporting Information.

Figures

FIGURE 1
FIGURE 1
Flow‐chart of the analysis pipeline.  (A) Subjects from ADNI were randomly split into a training sample (n = 246) and a test sample (n = 105). In the ADNI training sample, stepwise linear regression was performed to select those predictors which significantly contribute to prediction. For the final model, the coefficients of the predictors were averaged across folds and applied to the non‐seen validation samples including ADNI‐test, A4, and A05 to assess the prediction performance. (B) Calculation of epicenter‐based gradient distance. Tau epicenters were defined as top 10% ROIs showing highest tau‐PET levels in the ADNI training sample. For each gradient, the epicenter‐based gradient distance was computed as the average absolute difference of the gradient values between tau epicenter ROIs and each ROI across the brain. ADNI, Alzheimer's Disease Neuroimaging Initiative; ROI, region of interest.
FIGURE 2
FIGURE 2
Group‐average and annual change rate of tau‐PET SUVRs.  Average maps of tau‐PET SUVRs are shown as continuous values in CN Aβ+ participants, and MCI and dementia Aβ+ participants in ADNI training (A), ADNI test (B), A4 (C), and A05 (D) samples. Average maps of baseline tau‐PET SUVRs and annual change rate of tau‐PET SUVRs are shown as continuous values in MCI Aβ+ participants in ADNI (e) and A05 (f). Tau epicenters at baseline were shown in outlined white. Aβ, amyloid‐beta; ADNI, Alzheimer's Disease Neuroimaging Initiative; CN, cognitively normal; MCI, mild cognitive impairment; PET, positron emission tomography; SUVR, standardized uptake value ratio.
FIGURE 3
FIGURE 3
Contributions of multimodal gradient distances to group‐mean tau‐PET levels.  (A) Rank‐ordered average coefficients from cross‐validation of features selected by stepwise linear regression for predicting group‐average tau‐PET levels in CN Aβ+. (B) Scatterplots show the association between predicted group‐average tau‐PET levels against the observed group‐average tau‐PET levels in CN Aβ+ participants in ADNI training, ADNI test, and A4 sample. The pspin stands for the p values corrected by spatial‐autocorrelation‐preserving permutation tests. (C) Surface renderings show the spatial pattern of selected features. The radar charts show the distribution of mean gradient values in each canonical functional network. Aβ, amyloid‐beta; ADNI, Alzheimer's Disease Neuroimaging Initiative; CN, cognitively normal; PET, positron emission tomography.
FIGURE 4
FIGURE 4
Contributions of multimodal gradient distances to group‐mean tau‐PET levels.  (A) Rank‐ordered average coefficients from cross‐validation of features selected by stepwise linear regression for predicting group‐average tau‐PET levels in MCI/dementia Aβ+. (B) Scatterplots show the association between predicted group‐average tau‐PET levels against the observed group‐average tau‐PET levels in MCI/dementia Aβ+ participants in ADNI training, ADNI test, and A05 sample. The pspin stands for the p values corrected by spatial‐autocorrelation‐preserving permutation tests. (C) Surface renderings show the spatial pattern of selected features. The radar charts show the distribution of mean gradient values in each canonical functional network. Aβ, amyloid‐beta; ADNI, Alzheimer's Disease Neuroimaging Initiative; MCI, mild cognitive impairment; PET, positron emission tomography.
FIGURE 5
FIGURE 5
Performances of gradient distance‐based prediction of subject‐level tau‐PET SUVRs. Violin plots show the distribution of R 2 values for prediction of subject‐level tau‐PET SUVRs using the group‐derived multimodal gradient distance‐based predictive model in CN Aβ+ participants (A) in ADNI training, ADNI test and A4 sample, and MCI/dementia Aβ+ participants (B) in ADNI training, ADNI test and A05 sample. Aβ, amyloid‐beta; ADNI, Alzheimer's Disease Neuroimaging Initiative; CN, cognitively normal; MCI, mild cognitive impairment; PET, positron emission tomography; SUVR. standardized uptake value ratio.
FIGURE 6
FIGURE 6
Contributions of multimodal gradient distances to group‐mean tau‐PET annual change rates and prediction performances. (a) Rank‐ordered average coefficients from cross‐validation of features selected by stepwise linear regression for predicting group‐average tau‐PET annual change rates in MCI Aβ+ participants from ADNI. The scatterplots show the association between predicted group‐average tau‐PET levels against the observed group‐average tau‐PET levels in MCI Aβ+ participants in ADNI (B) and A05 (C). The pspin stands for the p values corrected by spatial‐autocorrelation‐preserving permutation tests. (C) Surface renderings show the spatial pattern of selected features. The radar charts show the distribution of mean gradient values in each canonical functional network. Aβ, amyloid‐beta; ADNI, Alzheimer's Disease Neuroimaging Initiative; MCI, mild cognitive impairment; PET, positron emission tomography.
FIGURE 7
FIGURE 7
Gene expression profiles associated with gene expression gradient 2.  Bubble plots show results of GO analyses for biological process (A), cellular component (B), and molecular function (C). The dots represent the GO terms corrected for multiple comparisons (FDR‐corrected at p < 0.05). Gene count means the number of genes in that pathway. (D) Protein‐protein interaction network shows the top 10 hub genes identified with a maximal centrality generated by Cytoscape. FDR, false discovery rate; GO, gene ontology.

References

    1. Alzheimer's Association . 2023 Alzheimer's disease facts and figures. Alzheimers Dement. 2023;19(4):1598‐1695. doi:10.1002/alz.13016 - DOI - PubMed
    1. Ossenkoppele R, Reimand J, Smith R, et al. Tau PET correlates with different Alzheimer's disease‐related features compared to CSF and plasma p‐tau biomarkers. EMBO Mol Med. 2021;13(8):e14398. doi:10.15252/emmm.202114398 - DOI - PMC - PubMed
    1. Braak H, Braak E. Neuropathological stageing of Alzheimer‐related changes. Acta Neuropathologica. 1991;82(4):239‐59. - PubMed
    1. Kaufman SK, Del Tredici K, Thomas TL, Braak H, Diamond MI. Tau seeding activity begins in the transentorhinal/entorhinal regions and anticipates phospho‐tau pathology in Alzheimer's disease and PART. Acta neuropathologica. 2018;136(1):57‐67. doi:10.1007/s00401-018-1855-6 - DOI - PMC - PubMed
    1. Chen SD, Lu JY, Li HQ, et al. Staging tau pathology with tau PET in Alzheimer's disease: a longitudinal study. Transl Psychiatry. 2021;11(1):483. doi:10.1038/s41398-021-01602-5 - DOI - PMC - PubMed