

doi: 10.1002/ctm2.70333.
CRISPRi screening identifies PIKfyve as a co-therapeutic target for obinutuzumab
Affiliations
- PMID: 40342289
- PMCID: PMC12059204
- DOI: 10.1002/ctm2.70333
Item in Clipboard
CRISPRi screening identifies PIKfyve as a co-therapeutic target for obinutuzumab
Clin Transl Med.
2025 May.
No abstract available
Conflict of interest statement
All authors have declared that no competing interest exists.
Figures
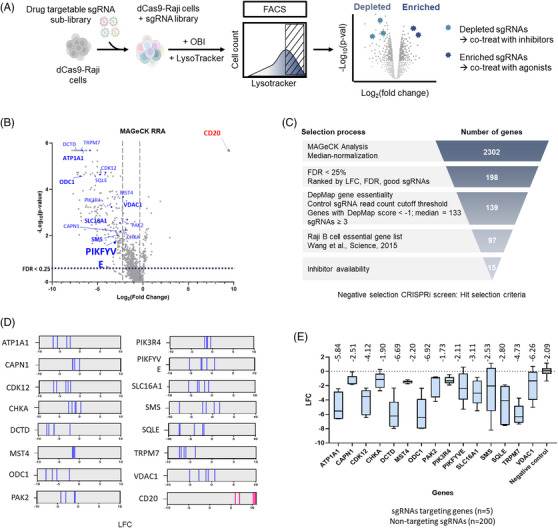
CRISPRi reveals modulators of OBI‐induced LMP. (A) Overview of CRISPRi screening. A sub‐library of sgRNAs targeting kinases, phosphatases, and drug target genes was delivered into dCas9‐Raji cells via a lentiviral system to create an sgRNA library pool. dCas9‐library‐Raji cells were treated with 10 µg/mL OBI for 4 h, stained with 50 nM Lysotracker (LT) for 30 min, and LT‐positive cells were sorted using FACS Aria III. Selected cells were expanded and re‐sorted through the same procedure for a total of 5 cycles, with the sgRNA sequences of the final selected cells analysed by NGS. (B) Volcano plot illustrating gene‐level enrichment and depletion following CRISPRi screening. Data were analysed using the MAGeCK algorithm to determine the statistical significance (–log₁₀p‐value) and magnitude (log₂ fold‐change) of sgRNA abundance in the selected cell population. Significantly enriched genes, indicative of a positive selection phenotype, are highlighted in red, whereas significantly depleted genes, corresponding to negative selection, are shown in blue. Labelled genes represent top candidates based on statistical ranking. (C) Stepwise selection of genes depleted by OBI‐induced lysosomal membrane permeabilisation (LMP). MAGeCK analysis identified 2302 candidate genes following median normalisation. Genes with FDR < 25% were further ranked by LFC, FDR, and sgRNA quality (n = 198). Essential genes were filtered using DepMap data (DepMap score < –1; higher than 3 sgRNAs), yielding 139 candidates. Cross‐referencing with the Raji B‐cell essential gene list refined the set to 97 genes. Final selection of 15 genes was based on inhibitor availability. (D) sgRNA enrichment plot displaying relative changes of 5 sgRNAs per gene. Depleted genes are indicated in blue, and enriched genes such as CD20 are shown in pink. (E) Box plot representing average log fold‐change (LFC) per gene. Numbers above indicate the median LFC for each gene.

Inhibition of PIKfyve activity is a synergistic target for amplifying OBI‐induced LMP. (A) Validation of mRNA expression reduction in dCas9‐Raji‐sgRNA cell lines stably expressing sgRNAs for 14 genes selected screening, compared to gene expression levels in dCas9‐Raji cells, as determined by quantitative PCR (qPCR). (B, C) LMP and DCD analysis in single sgRNA stably expressing dCas9‐Raji‐sgRNA cell lines. Six genes were identified that either showed consistent or dose‐dependent increases in LMP or DCD compared to cell survival rates in dCas9‐Raji cells treated with.3 µg/mL and 3 µg/mL OBI. (D) Positive correlation between LMP and DCD ratios in the context of 3 µg/mL OBI treatment. (E, F) Degree of DCD as determined by Propidium Iodide (PI) positive cell count analysis with 50 nM or 250 nM of inhibitors for the six selected genes, applied singly (E) or in combination with OBI (F). For single treatments, each inhibitor was pre‐treated for 24 h (E), and for combination with OBI treatments (F), cells were pre‐treated with each inhibitor for 24 h followed by treatment with.3 µg/mL OBI to measure cell death rates. (G, H) Increase in DCD by the combination treatment of Apilimod with OBI or RTX. The degree of DCD by dose‐dependent pre‐treatment of Apilimod (0, 10, 50, and 100 nM) for 24 h followed by dose‐dependent treatment of OBI (G), or RTX (H) (0,.3 µg/mL, and 3 µg/mL) for 4 h. (I, J) Increase in DCD by the combination treatment of Apilimod with OBI in two different B‐cell lymphoma cell lines. The degree of DCD in Ramos (I) and Jiyoye (J) cells by dose‐dependent pre‐treatment of Apilimod (0, 10, 50, and 100 nM) for 24 h followed by dose‐dependent treatment of OBI (0,.3 µg/mL, and 3 µg/mL) for 4 h. Statistical significance was calculated for the no treatment group and each antibody concentration treatment group at 100 nM of Apilimod condition. Data are presented as mean ± SEM, and calculated p‐values are shown for the difference between condition treated with 100 nM Apilimod without antibodies and with each concentration of antibody.

OBI and Apilimod induce LMP‐mediated cell death, validated across multiple cell lines and by cathepsin release. (A) The combinational effects of obinutuzumab (OBI,.3 µg/mL) and Apilimod (50 nM) significantly enhanced direct cell death (DCD) and lysosomal membrane permeabilisation (LMP) in Raji cells. LLOMe (1 and 10 mM) were used as a positive control to induced LMP. (B, C) The synergistic effect of Apilimod and OBI on DCD and LMP was confirmed in two additional B‐cell lymphoma cell lines, Ramos (B) and Jiyoye (C). (D) Immunofluorescence analysis of cathepsin B localisation revealed increased cytosolic release upon OBI + Apilimod co‐treatment, compared to OBI alone. LLOMe (1 mM) served as a reference for partial lysosomal disruption. (E) Apilimod markedly enhances cathepsin B release across all tested doses of OBI, indicating amplification of LMP. (F–H) The impact of P2 × 4 receptor inhibition (BAY‐1797, 50 µM), dual mTORC1/2 inhibition (OSI‐027, 50 µM), and selective mTORC1 inhibition (rapamycin, 100 nM) was assessed on DCD and LMP in the context of OBI + Apilimod treatment. (I) Lysosomal morphology and LysoTracker fluorescence intensity were assessed by confocal microscopy following LysoTracker Deep Red staining. All drugs were incubated overnight. Scale bars, 5 µm. Data are presented as mean ± SEM, and p‐values are compared between the OBI alone and OBI, API combinational treatment group and each inhibitor co‐treatment group. A p‐value < .05 is considered statistically significant. ‘ns’ indicates no significance.
References
Grants and funding
LinkOut - more resources
Full Text Sources