. 2025 May 8:9:0694.
doi: 10.34133/research.0694. eCollection 2025.

MiR-335-5p Escaped from CircKIAA0586 Adsorption Contributes to Mechanical Overloading-Induced Cartilage Degeneration by Targeting Lymphoid-Specific Helicase

Affiliations

MiR-335-5p Escaped from CircKIAA0586 Adsorption Contributes to Mechanical Overloading-Induced Cartilage Degeneration by Targeting Lymphoid-Specific Helicase

Haoyu Xie et al. Research (Wash D C). .

Abstract

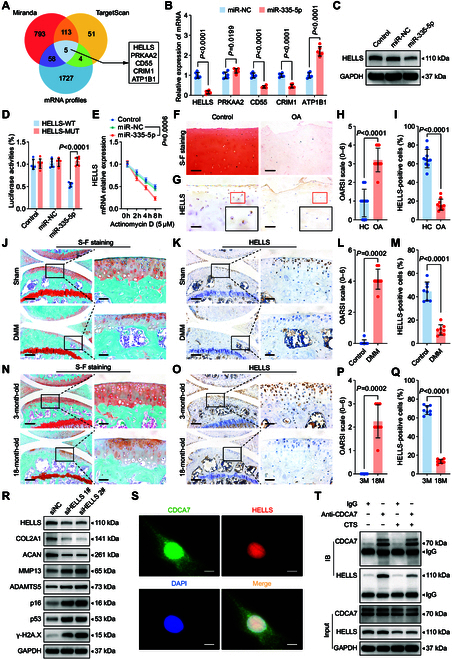
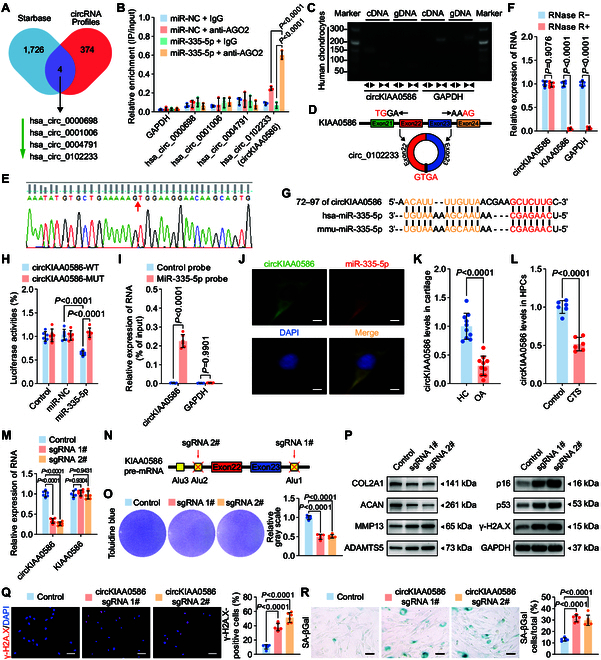
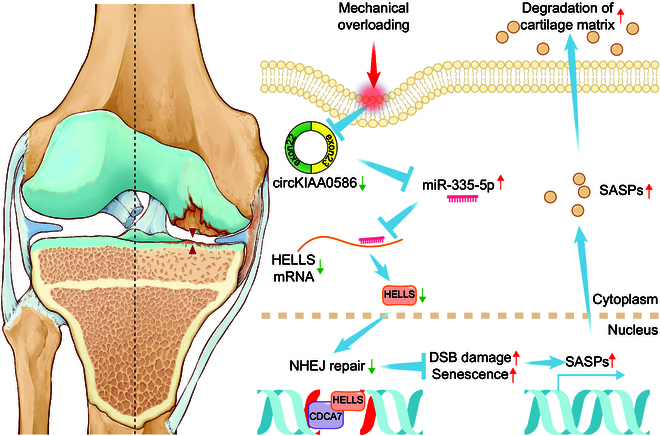
Mechanical overload is a critical contributor to cartilage degeneration in osteoarthritis (OA) pathogenesis. Circular RNA (circRNA) is expected to provide a long-lasting therapy for OA. However, the involvement of the circRNA-associated competitive endogenous RNA network in chondrocyte senescence induced by mechanical overloading remains unestablished. A mechanical overloading-induced chondrocyte senescence model in human primary chondrocytes is constructed, and differences in the expression of circRNAs and miRNAs were analyzed. The biological roles of circKIAA0586/miR-335-5p in chondrocyte senescence and OA progression under mechanical overloading and its downstream targets were determined using gain- and loss-of-function experiments in various biochemical assays in human chondrocytes. The in vivo effects of circKIAA0586 overexpression were also determined in destabilization of the medial meniscus (DMM) OA mice and aged spontaneous OA mice. The mechanical overloading-induced chondrocyte senescence was aggravated by miR-335-5p or circKIAA0586 knockdown. Accumulated DNA damage response was observed following mechanical overloading, which reduced after miR-335-5p inhibition or circKIAA0586 supplementation. MiR-335-5p was regulated by circKIA0586 adsorption. HELLS was prominently down-regulated following mechanical overloading treatment. Moreover, miR-335-5p bound to lymphoid-specific helicase (HELLS) mRNA during mechanical overloading was demonstrated to mediate the nonhomologous end joining (NHEJ) pathway, thereby inducing DNA damage and senescence. In addition, the senescence delaying and cartilage protective functions of circKIAA0586 and HELLS were validated in DMM OA mice and aged spontaneous OA mice. Our findings suggest that miR-335-5p, which escapes circKIAA0586 adsorption, facilitates mechanical overloading-induced chondrocyte senescence and OA progression by impairing the NHEJ pathway through HELLS inhibition. Overall, targeting circKIAA0586/miR-335-5p/HELLS signaling provides a novel therapeutic approach for OA.


Conflict of interest statement

Competing interests: The authors declare that they have no competing interests.

Figures

Fig. 1.
Fig. 1.
MiR-335-5p plays a pivotal role in mechanical overloading-induced chondrocyte senescence during osteoarthritis (OA). (A and B) Heatmap and volcano plot show differentially expressed miRNAs in overloaded human primary chondrocytes (cyclic tensile strain [CTS]) compared with control cells (NC). The arrows indicate miR-335-5p. (C) Expression of the TOP 10 candidate miRNAs in knee cartilage of OA patients and controls (n = 10 samples per group) were confirmed by quantitative reverse transcription polymerase chain reaction (qRT-PCR) analysis. (D and E) Representative images and quantification of toluidine blue staining of controls human primary chondrocytes transfected with miR-335-5p mimic or miR-NC (n = 5 per group). (F) Immunoblotting results for COL2A1, MMP13, ACAN, ADAMTS5, senescence markers (p16 and p53), and DNA damage marker γ-H2A.X in controls and human primary chondrocytes transfected with miR-335-5p mimic or miR-negative control (NC). (G to J) Representative images and quantification of γ-H2A.X immunofluorescence staining (G and H) and SA-βGal staining (I and J) in controls and human primary chondrocytes transfected with miR-335-5p mimic or miR-NC (n = 6 per group). Scale bars: 40 μm (G) and 20 μm (I). (K) Immunoblotting results for COL2A1, MMP3, ACAN, ADAMTS5, senescence markers (p16 and p53), and DNA damage marker γ-H2A.X in human primary chondrocytes administered with or without 20% CTS loading for 24 h after transfection with miR-335-5p inhibitor or inhibitor-NC. (L to O) Representative images and quantification of γ-H2A.X immunofluorescence staining (L and M) and SA-βGal staining (N and O) in human primary chondrocytes administered with or without 20% CTS loading for 24 h after transfected with miR-335-5p inhibitor or inhibitor-NC (n = 6 per group). Scale bars: 40 μm (L) and 20 μm (N). (P and Q) Representative images and quantification of toluidine blue staining of controls and human primary chondrocytes with or without miR-335-5p inhibition after treatment with 20% CTS loading for 24 h (n = 5 per group). The statistics are presented as the mean ± SD.
Fig. 2.
Fig. 2.
MiR-335-5p promotes chondrocyte senescence by inhibiting HELLS. (A) Schematic illustration showing the overlap of the target mRNAs of miR-335-5p, as predicted by Miranda, TargetScan, and mRNAs down-regulated in human chondrocytes treated with 20% CTS loading for 24 h. (B) qRT-PCR analysis detected target mRNA levels in human chondrocytes transfected with miR-335-5p (n = 6 per group). (C) Immunoblotting results for HELLS in control and human primary chondrocytes transfected with miR-NC or miR-335-5p. (D) Luciferase reporter assay showing luciferase activity of HELLS-wild type (WT) or HELLS-mutant (MUT) reporter plasmids in HEK-293T cells transfected with miR-335-5p or miR-NC (n = 6 per group). (E) qRT-PCR analysis detected the degradation of HELLS mRNA in human primary chondrocytes transfected with miR-335-5p or miR-NC after treated with 5 μmol·l−1 Actinomycin D at 0, 2, 4, and 8 h (n = 3 per time point). (F to I) Representative images and quantification of safranin O and fast green staining (F and G) and HELLS immunohistochemical staining (H and I) in knee cartilage of control and OA patients (n = 10 samples per group). Scale bar: 100 μm. (J to M) Representative images and quantification of safranin O and fast green staining (J and L) and immunohistochemical staining of HELLS (K and M) in knee cartilage from sham and destabilization of the medial meniscus (DMM) mice (n = 8 per group). Scale bars: 200 μm and 40 μm. (N to Q) Representative images and quantification of safranin O and fast green staining (N and P) and immunohistochemical staining of HELLS (O and Q) in knee cartilage from 3-month-old mice and 18-month-old spontaneous OA mice (n = 8 per group). Scale bars: 200 μm and 40 μm. (R) Immunoblotting results for HELLS, COL2A1, MMP13, ACAN, ADAMTS5, p16, p53, and γ-H2A.X in human primary chondrocytes after transfection with HELLS siRNA (siHELLS) or siNC. (S) Colocalization of CDCA7 and HELLS using immunofluorescent staining of human primary chondrocytes. Scale bar: 10 μm. (T) Coimmunoprecipitation assay using CDCA7 as bait protein in human primary chondrocytes exposed to or not to 20% CTS loading for 24 h. All chondrocytes from the surface of cartilage to the boundaries between cartilage and subchondral bone were included in the count. Data are presented as mean ± SD.
Fig. 3.
Fig. 3.
HELLS alleviates chondrocyte senescence and OA progression. (A) Immunoblotting results for HELLS, COL2A1, MMP3, ACAN, ADAMTS5, senescence markers (p16 and p53), and DNA damage marker γ-H2A.X in controls and human primary chondrocytes with or without HELLS overexpression after treatment with 20% CTS loading for 24 h. (B and C) Representative images and quantification of γ-H2A.X immunofluorescence staining (B) and SA-βGal staining (C) in controls and human primary chondrocytes with or without HELLS overexpression after treated with 20% CTS loading for 24 h (n = 6 per group). Scale bars: 40 μm (B) and 20 μm (C). (D) Schematic illustration showing the establishment of the DMM OA mouse model and aged spontaneous OA mouse model. DMM surgery is shown by the green arrows. The red arrows indicate the AAV intra-articular injection time points. The blue arrows indicate the sacrifice time points. (E to P) Representative images and quantification of safranin O and fast green staining (E and K) and HELLS (F and L), COL2A1 (G and M), MMP13 (H and N), p16 (I and O) and γ-H2A.X (J and P) immunofluorescence staining in knee cartilage from sham mice and DMM mice with control AAV or HELLS AAV administered at 8 weeks after DMM surgery (n = 8 per group). Scale bars: 100 μm (E) and 40 μm (F to J). (Q to AB) Representative images and quantification of safranin O and fast green staining (Q and W) and HELLS (R and X), COL2A1 (S and Y), MMP13 (T and Z), p16 (U and AA), and γ-H2A.X (V and AB) immunofluorescence staining in knee cartilage from aged spontaneous OA mice with control AAV or HELLS AAV administered (n = 8 per group). Scale bars: 100 μm (Q) and 40 μm (R to V). All chondrocytes from the surface of cartilage (white dotted line on top) to the boundaries between cartilage and subchondral bone (white dotted line below) were included in the count. The statistics are shown as the mean ± SD.
Fig. 4.
Fig. 4.
HELLS with synonymous mutation for miR-335-5p results in protection against OA. (A) Schematic illustration to show the synonymous mutation in the binding site of HELLS mRNA for miR-335-5p. (B and C) qRT-PCR analysis of HELLS (B), COL2A1, MMP3, ACAN, ADAMTS5, and senescence markers (p16 and p53) in human primary chondrocytes treated with 20% CTS loading for 24 h after transfection with miR-335-5p alone or together with HELLS or HELLS-MUT plasmids (n = 6 per group). (D) Immunoblotting results for COL2A1, MMP3, ACAN, ADAMTS5, senescence markers (p16 and p53), and DNA damage marker γ-H2A.X in controls and human primary chondrocytes treated with 20% CTS loading for 24 h after transfection with miR-335-5p alone or together with HELLS or HELLS-MUT plasmids. (E to J) Representative images and quantification of safranin O and fast green staining (E and F) and COL2A1 (G and H), MMP13 (I and J), p16 (K and L), and γ-H2A.X (M and N) immunofluorescence staining in knee cartilage from sham mice and DMM mice administered miR-335-5p AAV alone or together with HELLS AAV or HELLS-MUT AAV at 8 weeks after DMM surgery (n = 8 per group). Scale bars: 100 μm (E) and 40 μm (G, I, K, and M). All chondrocytes from the surface of cartilage (white dotted line on top) to the boundaries between cartilage and subchondral bone (white dotted line below) were included in the count. The statistics are presented as the mean ± SD.
Fig. 5.
Fig. 5.
CircKIAA0586 sponges miR-335-5p to regulate chondrocyte senescence and metabolism. (A) Schematic representation demonstrating the overlap of the upstream circRNAs of miR-335-5p, as predicted by TargetScan and circRNAs down-regulated in human chondrocytes treated with 20% CTS loading for 24 h. (B) AGO2 RNA immunoprecipitation in SW1353 cells transfected with miR-335-5p or miR-NC. The candidate circRNAs and GAPDH levels were quantified by qRT-PCR analysis, and the relative IP-to-input ratios were plotted (n = 3 per group). (C to E) Agarose gel electrophoresis (C) shows that divergent primers (←→) amplified circKIAA0586 in complementary DNA (cDNA) but not genomic DNA (gDNA) (top). The amplified product of specific divergent primers was confirmed in keeping with the sequence (D) of circKIAA0586 validated using Sanger sequencing (E). (F) qRT-PCR analysis for the abundance of circKIAA0586, KIAA0586 mRNA, and GAPDH mRNA in human primary chondrocytes treated with or without RNase R (n = 6 per group). (G) Schematic illustration to show the conserved circKIAA0586 binding site of human and mouse miR-335-5p. (H) Luciferase reporter assay shows luciferase activity of circKIAA0586-WT or -MUT reporter plasmids in controls and HEK-293T cells transfected with miR-335-5p or miR-NC (n = 6 per group). (I) RNA pulldown assay in SW1353 cells transfected with biotinylated miR-335-5p probes or control probes. The levels of circKIAA0586 and GAPDH were quantified using qRT-PCR analysis, and relative levels of circKIAA0586 were normalized to the input levels (n = 6 per group). (J) Representative FISH images showing the colocalization of circKIAA0586 and miR-335-5p in human primary chondrocytes. Scale bar: 10 μm. Data are presented as the mean ± SD. (K) qRT-PCR analysis detected circKIAA0586 levels in knee cartilage of controls and OA patients (n = 10 samples per group). (L) qRT-PCR analysis detected circKIAA0586 levels in human primary chondrocytes administered with 20% CTS loading for 24 h and control cells (n = 6 per group). (M and N) qRT-PCR analysis (M) validated the specific knockdown of circKIAA0586 in human primary chondrocytes after transfection of CRISPR/Cas9 knockdown plasmids targeting circKIAA0586 cyclization elements (N) (n = 6 per group). (O) Representative images and quantification of toluidine blue staining of human primary chondrocytes transfected with circKIAA0586 knockdown plasmids or control empty vector (n = 5 per group). (P) Immunoblotting results for OL2A1, MMP13, ACAN, ADAMTS5, senescence markers (p16 and p53), and DNA damage marker γ-H2A.X in human primary chondrocytes with circKIAA0586 knockdown plasmids or control plasmids. (Q and R) Representative images and quantification of γ-H2A.X immunofluorescence staining (Q) and SA-βGal staining (R) in human primary chondrocytes transfected with circKIAA0586 knockdown plasmids or control empty vector (n = 6 per group). Scale bars: 40 μm (Q) and 20 μm (R). Data are presented as the mean ± SD.
Fig. 6.
Fig. 6.
CircKIAA0586 alleviates OA by adsorbing miR-335-5p. (A) qRT-PCR analysis of circKIAA0586 and HELLS in human primary chondrocytes exposed to 20% CTS loading for 24 h after transfection of control vector, circKIAA0586, or circKIAA0586-MUT (n = 6 per group). (B) Schematic depiction to demonstrate the mutation in the binding site of circKIAA0586 for miR-335-5p. (C) qRT-PCR analysis detected the degradation of HELLS mRNA in human primary chondrocytes overexpressing control vector, circKIAA0586, or circKIAA0586-MUT after treating with 20% CTS loading and 5 μmol·l−1 Actinomycin D together at 0, 2, 4, and 8 h (n = 3 per time point). (D) Immunoblotting results for HELLS, COL2A1, MMP3, ACAN, ADAMTS5, p16, p53, and γ-H2A.X in human primary chondrocytes treated with 20% CTS loading for 24 h after transfection of control vector, circKIAA0586, or circKIAA0586-MUT. (E to J) Representative images and quantification of toluidine blue staining (E and H), γ-H2A.X immunofluorescence staining (F and I), and SA-βGal staining (G and J) in human primary chondrocytes treated with 20% CTS loading for 24 h after transfection of control vector, circKIAA0586, or circKIAA0586-MUT (n = 5 or 6 per group). Scale bars: 40 μm (E) and 20 μm (F). (K to S) Representative images and quantification of safranin O and fast green staining (K and P) and COL2A1 (L), MMP13 (M and R), p16 (N and R), and γ-H2A.X (O and S) immunofluorescence staining in knee cartilage from sham and DMM mice administered control AAV, circKIAA0586 AAV, or circKIAA0586-MUT AAV at 8 weeks after DMM surgery (n = 8 per group). Scale bars: 100 μm (K) and 40 μm (L to O). (T to AB) Representative images and quantification of safranin O and fast green staining (T and Y) and COL2A1 (U), MMP13 (V and Z), p16 (W and AA), and γ-H2A.X (X and AB) immunofluorescence staining in knee cartilage from 18-month-old mice administered control AAV, circKIAA0586 AAV, or circKIAA0586-MUT AAV (n = 8 per group). Scale bars: 100 μm (first row) and 40 μm (other rows). All chondrocytes from the surface of cartilage (white dotted line on top) to the boundaries between cartilage and subchondral bone (white dotted line below) were included in the count. Data are presented as means ± SD.
Fig. 7.
Fig. 7.
Schematic representation of the working hypothesis. During mechanical overloading, miR-335-5p evades the adsorption of circKIAA0586, allowing it to bind with HELLS mRNA and suppress HELLS expression. Consequently, loss of HELLS impairs the DNA damage repair function of the HELLS/CDCA7 complex, leading to DNA damage accumulation and chondrocyte senescence, resulting in accelerated cartilage degeneration and OA development.

Similar articles

Cited by

References

    1. Quicke JG, Conaghan PG, Corp N, Peat G. Osteoarthritis year in review 2021: Epidemiology & therapy. Osteoarthr Cartil. 2022;30(2):196–206. - PubMed
    1. Safiri S, Kolahi AA, Smith E, Hill C, Bettampadi D, Mansournia MA, Hoy D, Ashrafi-Asgarabad A, Sepidarkish M, Almasi-Hashiani A, et al. . Global, regional and national burden of osteoarthritis 1990-2017: A systematic analysis of the global burden of disease study 2017. Ann Rheum Dis. 2020;79(6):819–828. - PubMed
    1. Hunter DJ, Bierma-Zeinstra S. Osteoarthritis. Lancet. 2019;393(9991):1745–1759. - PubMed
    1. Visser AW, Mutsert R, Cessie S, Heijer M, Rosendaal FR, Kloppenburg M, Group NEOS . The relative contribution of mechanical stress and systemic processes in different types of osteoarthritis: The NEO study. Ann Rheum Dis. 2015;74(10):1842–1847. - PubMed
    1. Andriacchi TP, Favre J. The nature of in vivo mechanical signals that influence cartilage health and progression to knee osteoarthritis. Curr Rheumatol Rep. 2014;16(11):463. - PubMed

LinkOut - more resources