. 2025 Apr 24:15:1563990.
doi: 10.3389/fonc.2025.1563990. eCollection 2025.

Impact of primary cancer history and molecular landscape in therapy-related myeloid neoplasms

Affiliations

Impact of primary cancer history and molecular landscape in therapy-related myeloid neoplasms

Alessandro Costa et al. Front Oncol. .

Abstract

Background: Therapy-related myeloid neoplasms (t-MN) are aggressive hematologic malignancies with poor prognosis and high-risk clinical features. Recent advances have highlighted the role of molecular data in refining prognostic models. This study aims to analyze a monocentric cohort of t-MN patients, focusing on the clinical and prognostic impact of prior malignancies and their associated molecular landscape.

Methods: A retrospective analysis was conducted on 61 patients diagnosed with t-MN from an Oncology Hospital and referred to a hematology Unit. Diagnoses were based on established criteria for therapy-related myelodysplastic syndrome (t-MDS) and therapy-related acute myeloid leukemia (t-AML), with a history of prior exposure to cytotoxic therapy. Cytogenetic and molecular analyses supported the diagnoses. Risk stratification was performed using the revised International Prognostic Scoring System (IPSS-R) and molecular IPSS (IPSS-M) for t-MDS and the 2022 European LeukemiaNet (ELN) classification for t-AML.

Results: Overall, 61 patients with t-MN were diagnosed: 38 (62.3%) with t-MDS, and 23 (37.7%) with t-AML. The median latency from primary cancer to t-MN diagnosis was 5.8 years (IQR: 2.6-12.5). Risk stratification identified 63.2% of t-MDS cases as IPSS-R very-low to intermediate risk, while 57.9% were reclassified as IPSS-M moderate-high to very high risk. Patients with prior hematologic cancer showed a greater tendency toward higher IPSS-R (p=0.021) and IPSS-M (p=0.015) risk compared to solid cancer. The IPSS-M, more accurately than R-IPSS, demonstrated predictive value for survival in both univariate and multivariate analyses and effectively predicted leukemic progression in t-MDS. TP53-mutated cases were more prevalent in patients with prior hematologic cancer (p=0.043) and associated with longer latency (8.2 years) compared to TP53 wild type (6.1 years, p=0.044). Allogeneic transplantation proved beneficial, significantly improving survival outcomes in eligible t-MDS and t-AML patients.

Conclusions: t-MN exhibits distinct clinical and molecular profiles according to prior malignancy type. Intriguingly, our analysis reveals a distinct latency pattern in TP53-mutated cases, suggesting unique leukemogenic dynamics. Moreover, IPSS-M proved highly accurate in predicting t-MDS survival. Integrating molecular data into prognostic models enhances risk stratification and informs therapeutic strategies, potentially improving outcomes for t-MN patients. Further studies are needed to validate these findings and refine tailored treatment approaches.

Keywords: TP53 mutation; allogeneic transplantation; hematologic cancer; latency; molecular profiling; solid cancer; therapy-related myeloid neoplasm.


Conflict of interest statement

The authors declare that the research was conducted in the absence of any commercial or financial relationships that could be construed as a potential conflict of interest.

Figures

Figure 1
Figure 1
Distribution of primary cancer diagnoses (A) and prior cytotoxic therapies (B) according to diagnosis of t-MDS and t-AML. The percentages reported within the bars were calculated based on the total number of patients with t-MN (n=61). APL, acute promyelocytic leukemia; B-ALL, Acute lymphoblastic leukemia B; CLL, chronic lymphocytic leukemia; GI, gastrointestinal; GU, genitourinary; HL, Hodgkin lymphoma; HLH, hemophagocytic lymphohystiocytosis; HT, hormone therapy; IMiDs, immunomodulatory drugs; MM, multiple myeloma; NHL, non-Hodgkin lymphoma; t-AML, therapy-related acute myeloid leukemia; t-MDS, therapy-related myelodysplastic syndrome; t-MN, therapy-related myeloid neoplasms.
Figure 2
Figure 2
Different latencies from primary cancer to t-MN according to cytogenetic and molecular abnormalities. Boxplots display the distribution of latency times, with individual values, median, and outliers shown for each molecular and cytogenetic subgroup. Statistical differences were assessed using the Kruskal-Wallis test. TP53-mut cases exhibited a longer median latency compared to TP53-wt [8.2 years (IQR: 4.6–19.3) vs. 6.1 years (IQR: 1.9–17.0), p = 0.044]. In contrast, no significant differences were observed when comparing TP53-mut cases to DTA-mut [3.0 years (IQR: 1.9–9.1), p = 0.23] or SF3B1-mut cases [3.1 years (IQR: 1.7–5.6), p = 0.450]. Similarly, no significant differences were found between cases with a normal karyotype [4.2 years (IQR: 1.9–11.0)] and those with a complex karyotype [7.5 years (IQR: 4.3–12.1), p = 0.466], -7/del(7q) [8.2 years (IQR: 3.5–18.2), p = 0.429], or -5/del(5q) [8.2 years (IQR: 2.8–10.2), p = 0.315]. DTA, DNMT3A, ASXL1 and TET2; IQR, interquartile range; mut, mutated; ns, not significative; t-MN, therapy-related myeloid neoplasms; wt, wild-type.
Figure 3
Figure 3
Comparison of risk stratification according to (A) IPSS-R and (B) IPSS-M in t-MDS cohort, categorized by prior history of solid or hematologic malignancy. In both panels, bars represent the two groups (solid tumor vs hematologic cancer), with internal segments corresponding to individual risk categories. The numbers within each segment indicate the absolute number of patients per risk category. In panel (A), based on the IPSS-R classification, among patients with a history of solid tumors (n=23), 12 patients (52.2%) were classified as very low risk, 5 (21.7%) as low risk, 2 (8.7%) as intermediate risk, and 4 (17.4%) as high or very high risk. In contrast, among patients with prior hematologic malignancies (n=15), 1 patient (6.7%) were categorized as very low risk, 2 (13.3%) as low risk, 4 (26.7%) as intermediate risk, and 8 patients (53.3%) as high or very high risk, indicating a significantly higher proportion of patients in the higher-risk categories in this group (Chi-square test, p = 0.020). In panel (B), among patients evaluable for IPSS-M (n=19), those with a history of solid tumors (n=8) were stratified as very low in 3 patients (37.5%), low in 3 patients (37.5%), and high or very high in 2 patients (25.0%). Conversely, patients with prior hematologic malignancies (n=11) were classified as moderate-low in 2 patients (18.2%), moderate-high in 2 patients (18.2%), and high or very high in 7 patients (63.6%), demonstrating a significantly greater representation in the higher-risk categories (Chi-square test, p = 0.012). IPSS-M, molecular international prognostic scoring system; IPSS-R, revised IPSS; t-MDS, therapy-related myelodysplastic syndrome.
Figure 4
Figure 4
Distribution of (A) karyotype abnormalities in t-MDS patients with available cytogenetic data (n=36) and (B) NGS-detected mutations in patients who underwent NGS analysis (n=19). The percentages reported within the bars were calculated based on the total number of patients in each respective group. NGS, next-generation sequencing; t-MDS, therapy-related myelodysplastic syndrome.
Figure 5
Figure 5
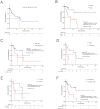
Kaplan-Meier curves for overall survival (OS) in t-MDS in the whole cohort (A), and stratified by sex (B), prior malignancies (C), TP53 (D), DTA mutational status (E), and disease progression (F). AML, acute myeloid leukemia; DTA, DNMT3A, TET2 and ASXL1; t-MDS, therapy-related myelodysplastic syndrome; wt, wild-type.
Figure 6
Figure 6
Kaplan-Meier curves for progression-free survival (PFS) according to (A) IPSS-R and (B) IPSS-M. Panel (A) shows PFS stratified by IPSS-R risk categories, with no significant differences observed between cohorts in 6-month PFS (p=0.320). Panel (B) presents PFS stratified by IPSS-M, demonstrating a statistically significant difference between risk categories in 6-month PFS (p=0.038). IPSS-M, molecular international prognostic scoring system; IPSS-R, revised IPSS.
Figure 7
Figure 7
Distribution of (A) karyotype abnormalities in evaluable patients (n=23) and molecular mutations detected through (B) Real-time PCR (evaluated patients, n=21) and (C) NGS (evaluated patients, n=12). The percentages reported within the bars were calculated based on the total number of patients in each respective group. NGS, next-generation sequencing; PCR, polymerase chain reaction.
Figure 8
Figure 8
Kaplan-Meier curves for overall survival (OS) in t-AML in the whole cohort (A), and stratified by prior malignancies (B), fitness according to SIE/SIES/GITMO criteria (C), and transplantation (D). HSCT, hematopoietic stem cell transplant; t-AML, therapy-related acute myeloid leukemia; SIE, Società Italiana di Ematologia; SIES, Società Italiana di Ematologia Sperimentale; GITMO, Gruppo Italiano per il Trapianto di Midollo Osseo.

References

    1. Arber DA, Orazi A, Hasserjian RP, Borowitz MJ, Calvo KR, Kvasnicka HM, et al. . International Consensus Classification of Myeloid Neoplasms and Acute Leukemias: integrating morphologic, clinical, and genomic data. Blood. (2022) 140:1200–28. doi: 10.1182/blood.2022015850 - DOI - PMC - PubMed
    1. Khoury JD, Solary E, Abla O, Akkari Y, Alaggio R, Apperley JF, et al. . The 5th edition of the world health organization classification of haematolymphoid tumours: myeloid and histiocytic/dendritic neoplasms. Leukemia. (2022) 36:1703–19. doi: 10.1038/s41375-022-01613-1 - DOI - PMC - PubMed
    1. Siegel RL, Giaquinto AN, Jemal A. Cancer statistics, 2024. CA Cancer J Clin. (2024) 74:12–49. doi: 10.3322/caac.21830 - DOI - PubMed
    1. Moreno Berggren D, Garelius H, Willner Hjelm P, Nilsson L, Rasmussen B, Weibull CE, et al. . Therapy-related MDS dissected based on primary disease and treatment—a nationwide perspective. Leukemia. (2023) 37:1103–12. doi: 10.1038/s41375-023-01864-6 - DOI - PMC - PubMed
    1. Nilsson C, Linde F, Hulegårdh E, Garelius H, Lazarevic V, Antunovic P, et al. . Characterization of therapy-related acute myeloid leukemia: increasing incidence and prognostic implications. Haematologica. (2022) 108:1015. doi: 10.3324/haematol.2022.281233 - DOI - PMC - PubMed

LinkOut - more resources