. 2025 Apr 11:15:1477649.
doi: 10.3389/fonc.2025.1477649. eCollection 2025.

PITX1 as a grading, prognostic and tumor-infiltrating immune cells marker for chondrosarcoma: a public database-based immunoassay and tissue sample analysis

Affiliations

PITX1 as a grading, prognostic and tumor-infiltrating immune cells marker for chondrosarcoma: a public database-based immunoassay and tissue sample analysis

Zikun Huang et al. Front Oncol. .

Abstract

Background: Chondrosarcoma (CHS) is a rare bone cancer originating from chondrocytes, with high-grade cases associated with high mortality rates. However, the prognostic factors and therapeutic targets for CHS have not been studied.

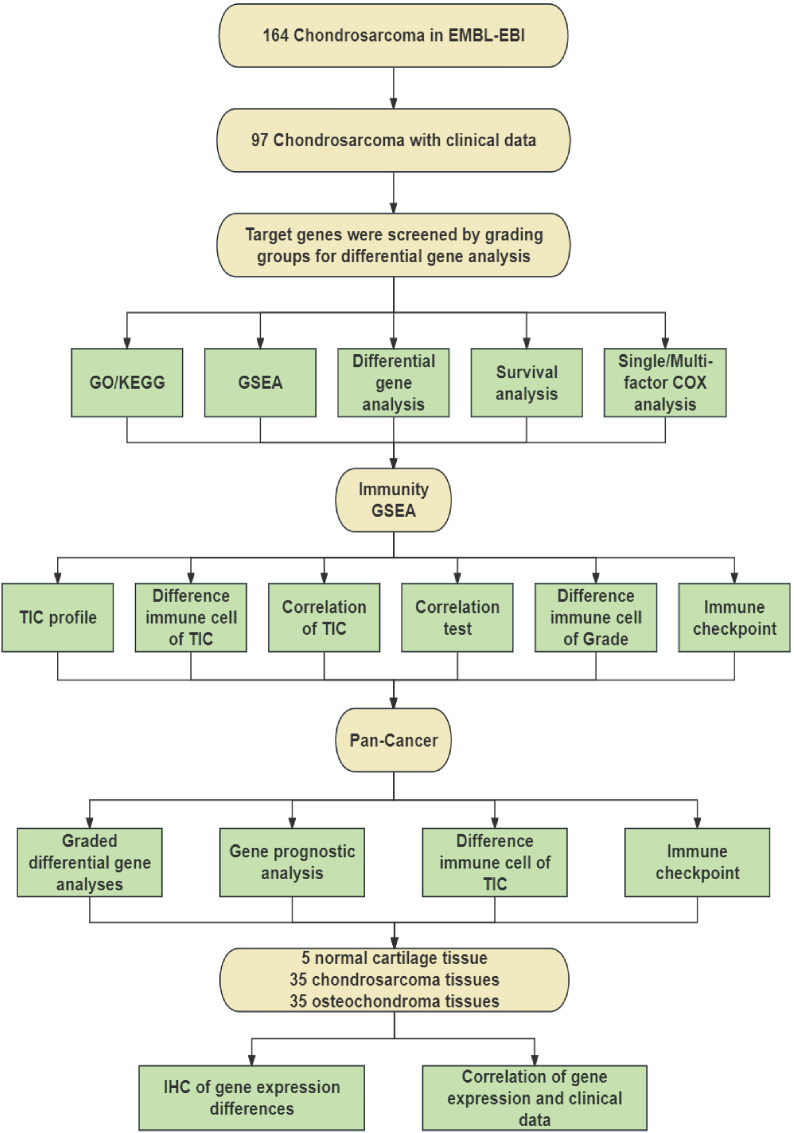
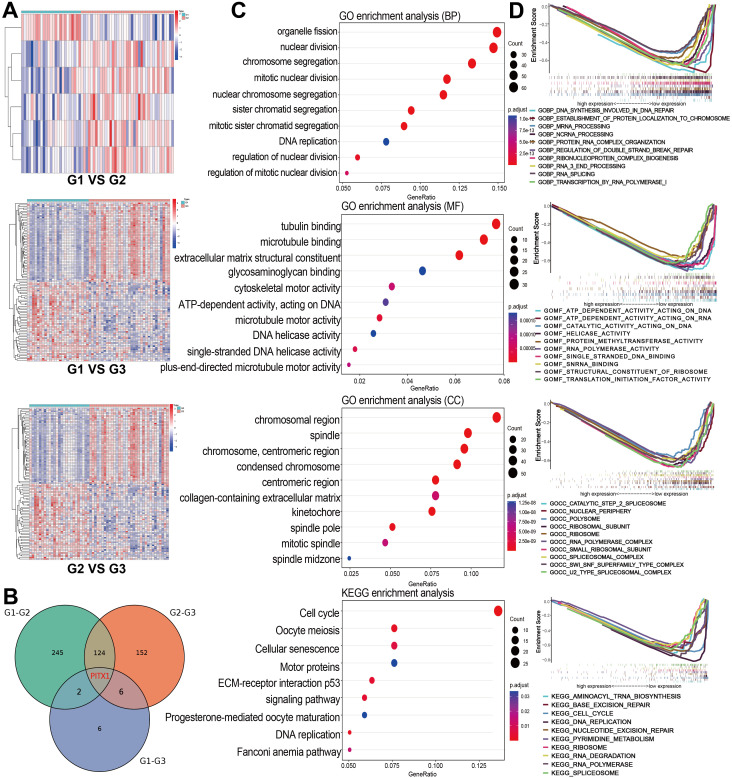
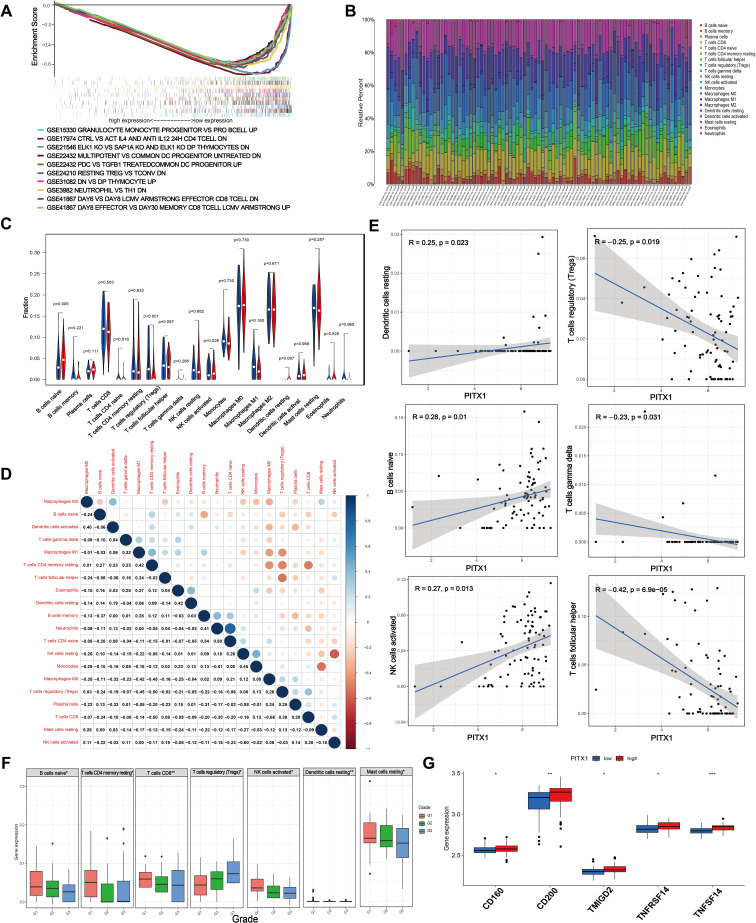
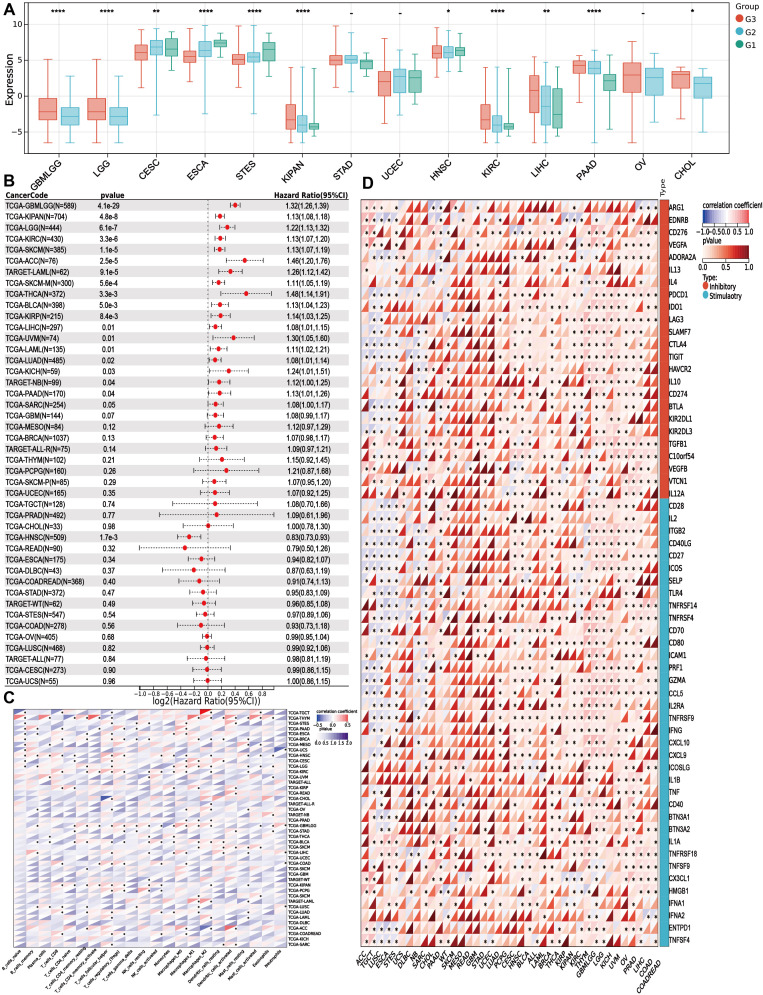
Methods: Graded gene differential analysis was conducted on 97 CHS tissues to identify genes associated with CHS grading. Additionally, we performed GO and KEGG enrichment analyses of the differentially-expressed genes (DEGs), as well as GSEA analysis, differential expression analysis, survival analysis, and univariable and multifactorial COX analysis of paired-like homology structural domain transcription factor 1 (PITX1). Furthermore, our findings investigated the relationship between tumor-infiltrating immune cells (TICs) in CHS tumors using CIBERSORT to calculate proportions and differences. Our findings also explored the associations among gene expression patterns, survival prognosis, TICs, and immune checkpoints across various cancer types. Finally, immunohistochemical staining was carried out on self-collected clinical samples to assess PITX1 expression levels and correlate them with clinical information.

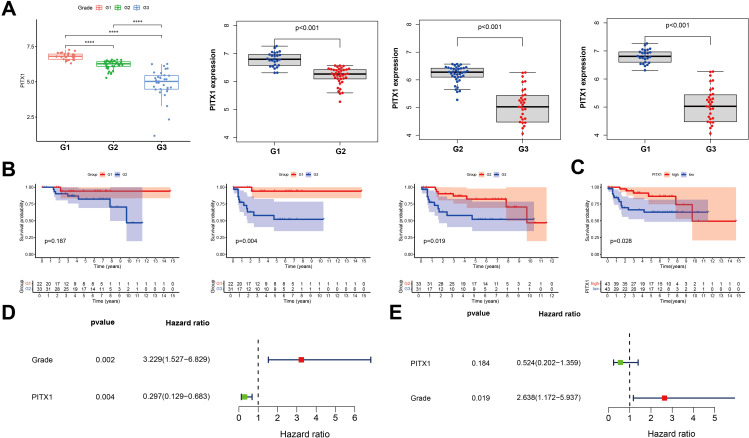
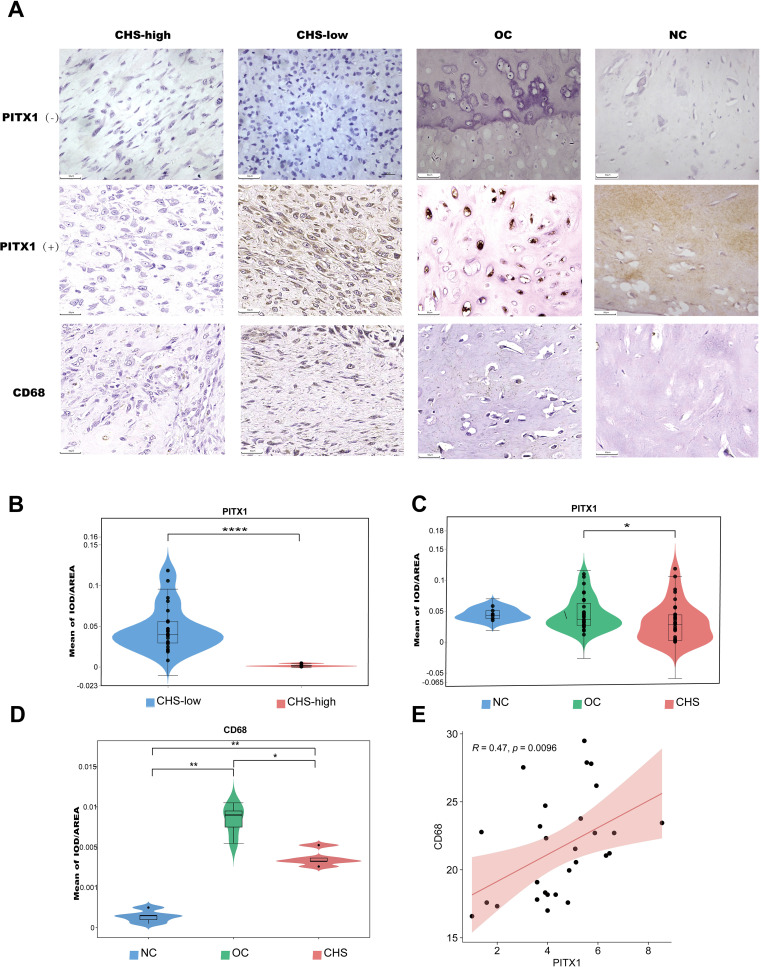
Results: Gene differential expression analysis revealed a strong correlation between PITX1 expression and tumor grade. GO, KEGG enrichment, and GSEA analysis demonstrated the association of PITX1 with cell proliferation-related processes, such as cell cycle regulation and mitosis, and differentiation-related processes, such as RNA processing. PITX1 expression was associated with tumor stage and survival outcomes. Immunoassay indicated a positive correlation between PITX1 levels and TICs, immune checkpoints, and graded TICs. Pan-cancer analysis confirmed the differential expression of the PITX1 gene across multiple cancers, impacting survival prognosis, TIC patterns, and immune checkpoint regulation. Lastly, our 75 collection of clinical patient tissue samples exhibited varying levels of PITX1 expression across different cancer grades while also demonstrating a significant association with tumor differentiation and metastasis.

Conclusion: PITX1 is a novel biomarker for distinguishing between high-grade and low-grade CHS, serving as a prognostic indicator for patients with this condition and presenting a promising target for immunotherapy. These findings offer innovative insights into the treatment of CHS.

Keywords: PITX1; chondrosarcoma (CHS); immune targets; tumor grade; tumor-infiltrating immune cell (TIC).


Conflict of interest statement

The authors declare that the research was conducted in the absence of any commercial or financial relationships that could be construed as a potential conflict of interest.

Figures

Figure 1
Figure 1
Schematic workflow of this study.
Figure 2
Figure 2
PITX1 expression correlates with CHS grade and proliferation (A) Heatmaps of DEGs were obtained by two-by-two comparisons between different grades of CHS. The line names in the heat map are the gene names, and the column names are the sample IDs not shown in the map. (B) Venn diagram showing the overlap of DEGs among the three groups, highlighting PITX1. (C) GO and KEGG enrichment analysis of all DEGs obtained from the three groups, the terms p and q < 0.05 were considered to be significantly enriched. (D) Gene sets enriched in samples with low PITX1 expression in the BP, CC, MF, and KEGG collections. Gene sets with unique color, and up-regulated genes located in the left approaching the origin of the coordinates, by contrast the down-regulated lay on the right of x-axis. Only several leading gene sets are displayed in the plot.
Figure 3
Figure 3
PITX1 is low-expression in high-grade and can be a protective factor in CHS (A) Box plot of PITX1 expression among groups of different tumor grades. (B) Expression of PITX1 was assessed using Kaplan-Meier survival analysis in patients with CHS. (C) Kaplan-Meier survival analysis. Patients were divided into high expressors or low expressors, depending on the comparison with the median expression level. P = 0.028 by log-rank test. (D) Forest plot showing univariate Cox regression analysis for grade and PITX1 expression with hazard ratios. (E) Forest plot showing multivariate Cox regression analysis with hazard ratios and p-values.
Figure 4
Figure 4
PITX1 regulates infiltration of TICs and immune checkpoints in CHS. (A) Gene sets enriched in low PITX1-expressing samples in immune collections. Gene sets with unique color, and up-regulated genes located in the left approaching the origin of the coordinates, by contrast the down-regulated lay on the right of x-axis. Only several leading gene sets are displayed in the plot. (B) Barplot showing the proportion of 20 types of TICs in CHS samples. Column names in the plot are the sample IDs. (C) Violin plot showing the ratio of differentiation of 20 kinds of immune cells between CHS samples with low or high PITX1 expression relative to the median of PITX1 expression level, and Wilcoxon rank sum was used for the significance test. (D) Heatmap showing the correlation between 20 kinds of TICs, and the number in each tiny box indicates the p-value of the correlation between two kinds of cells. The shade of each tiny color box represents the corresponding correlation value between two cells, and the Pearson coefficient was used for the significance test. (E) Scatter plot showing the correlation of 6 different TIC proportions and PITX1 expression (p < 0.05). The red line in each plot is a fitted linear model indicating the proportion of tropism of the immune cell along with PITX1 expression, and the Pearson coefficient was used for the correlation test. (F) Box showing the differential expression levels of different types of immune cells in different grades (p < 0.05). (G) Box showing the differential immune checkpoints based on PITX1 expression (p < 0.05).
Figure 5
Figure 5
PITX1 can act as a marker for tumor grade and as an immunotherapy target in multiple cancers (A) Box plots showing the difference in PITX1 expression among different grades in 14 cancers. And Wilcoxon rank sum were used for the significance tests. (B) Forest plots showing the results of univariate COX regression analysis of PITX1 expression in 39 cancer tissues. (C) Heatmap showing the correlation between 22 TICs and 39 cancer tissues, with the number in each small box representing the p-value of the correlation between the two. The depth of each small color box represents the corresponding correlation value between the two cells. The Pearson coefficient was used to determine significance. (D) Heatmap showing the correlation between PITX1 expression and the expression of multiple immune checkpoint genes across different cancer types. (* p<0.05, **p<0.01, *** p<0.001).
Figure 6
Figure 6
PITX1 is associated with differentiation and metastasis in CHS patients. (A) The expression of PITX1 in patient tissues was detected by IHC. First column: high-grade CHS weakly expressing/not expressing PITX1,CD68; second column: low-grade CHS strongly expressing/not expressing PITX1,CD68; third column: OC strongly expressing/not expressing PITX1,CD68; fourth column: normal cartilage tissue strongly expressing/not expressing PITX1,CD68. (B) Mean intensity of PITX1 expression in CHS (low-grade vs high-grade) (****p<0.001). (C) Comparison of the mean of IOD in CHS, OC and normal cartilage (* p<0.05). (D) Comparison of the mean of IOD in CHS, OC and normal cartilage (* p<0.05, **p<0.001). (E) Scatterplot showing the correlation between CD68 and PITX1 expression (p < 0.05). The red line in each plot is a fitted linear model indicating the relationship between CD68 and PITX1 expression, and the correlation test used the Pearson coefficient.

Similar articles

References

    1. Riedel RF, Larrier N, Dodd L, Kirsch D, Martinez S, Brigman BE. The clinical management of chondrosarcoma. Curr Treat Options Oncol. (2009) 10(1-2):94–106. doi: 10.1007/s11864-009-0088-2 - DOI - PubMed
    1. Damron TA, Ward WG, Stewart A. Osteosarcoma, chondrosarcoma, and Ewing’s sarcoma: National Cancer Data Base Report. Clin Orthop Relat Res. (2007) 459:40–7. doi: 10.1097/BLO.0b013e318059b8c9 - DOI - PubMed
    1. Fiorenza F, Abudu A, Grimer RJ, Carter SR, Tillman RM, Ayoub K, et al. . Risk factors for survival and local control in chondrosarcoma of bone. J Bone Joint Surg Br. (2002) 84(1):93–9. doi: 10.1302/0301-620x.84b1.11942 - DOI - PubMed
    1. van Oosterwijk JG, Anninga JK, Gelderblom H, Cleton-Jansen AM, Bovée JV. Update on targets and novel treatment options for high-grade osteosarcoma and chondrosarcoma. Hematol Oncol Clin North Am. (2013) 27(5):1021–48. doi: 10.1016/j.hoc.2013.07.012 - DOI - PubMed
    1. Bone sarcomas: ESMO clinical practice guidelines for diagnosis, treatment and follow-up. Ann Oncol. (2012) 23 Suppl 7:vii100–109. doi: 10.1093/annonc/mds254 - DOI - PubMed

LinkOut - more resources