. 2025 Apr 23:32:101793.
doi: 10.1016/j.mtbio.2025.101793. eCollection 2025 Jun.

Self-assembly of paclitaxel derivative and fructose as a potent inducer of immunogenic cell death to enhance cancer immunotherapy

Affiliations

Self-assembly of paclitaxel derivative and fructose as a potent inducer of immunogenic cell death to enhance cancer immunotherapy

Manzhen Li et al. Mater Today Bio. .

Abstract

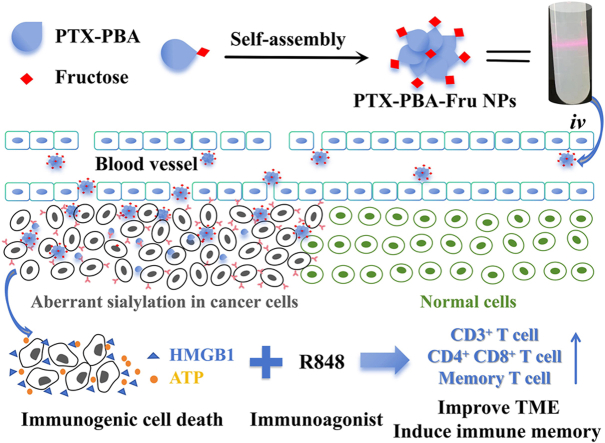
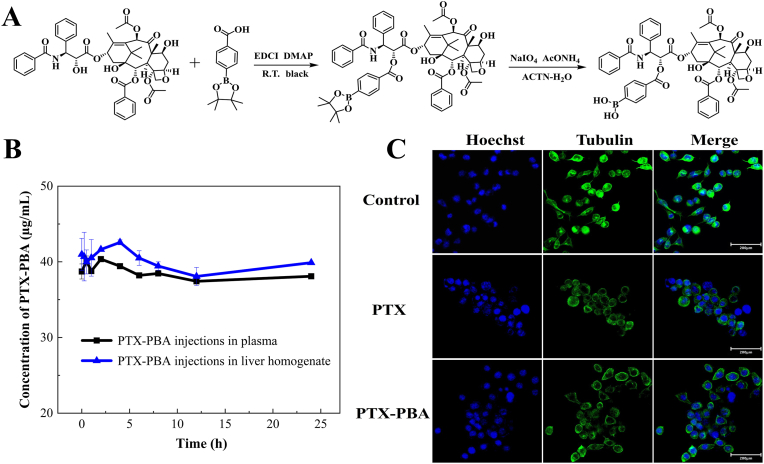
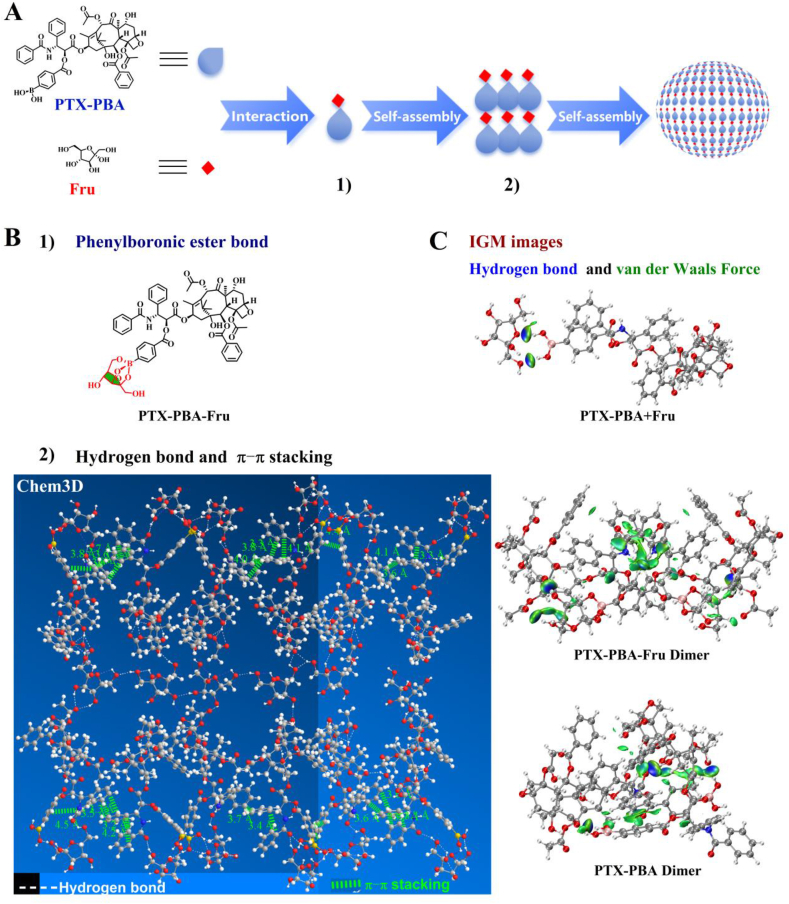
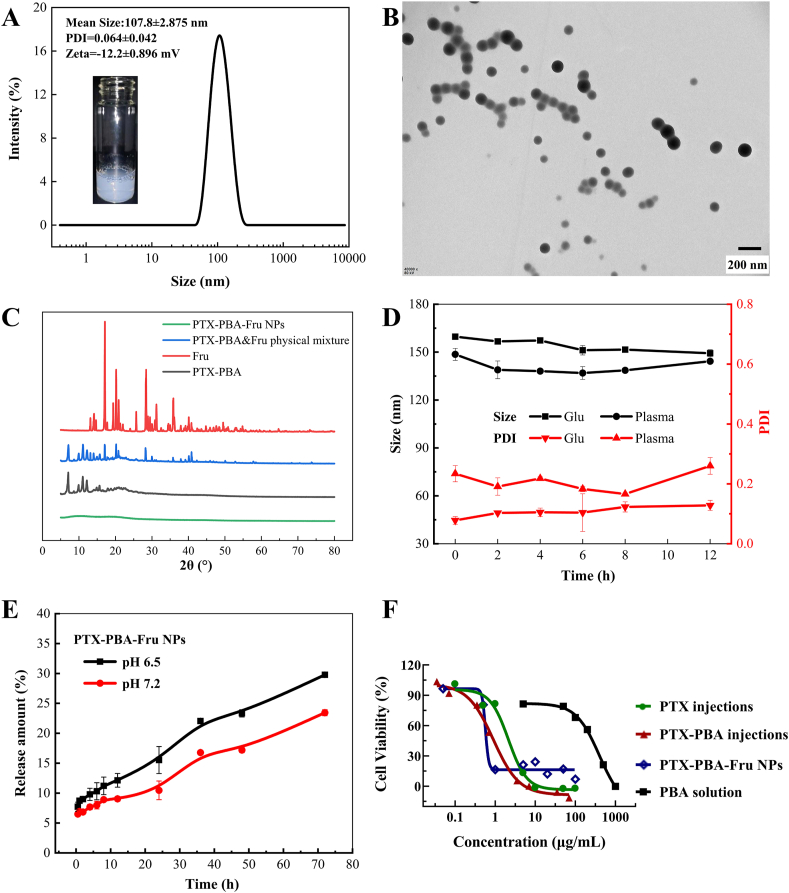
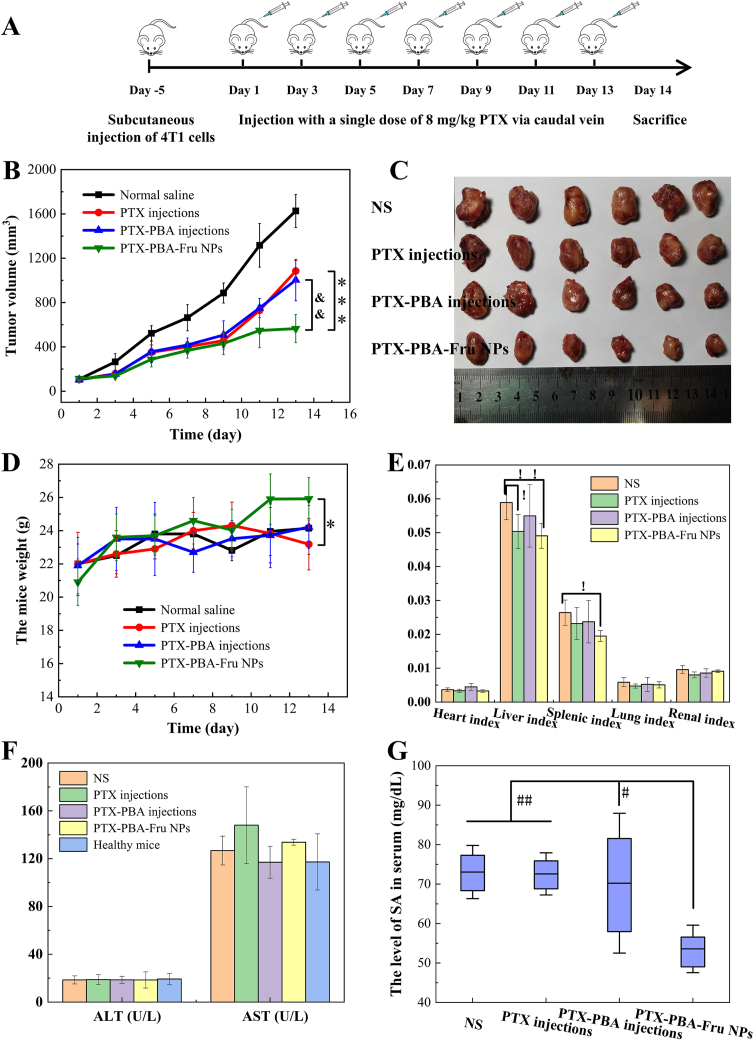
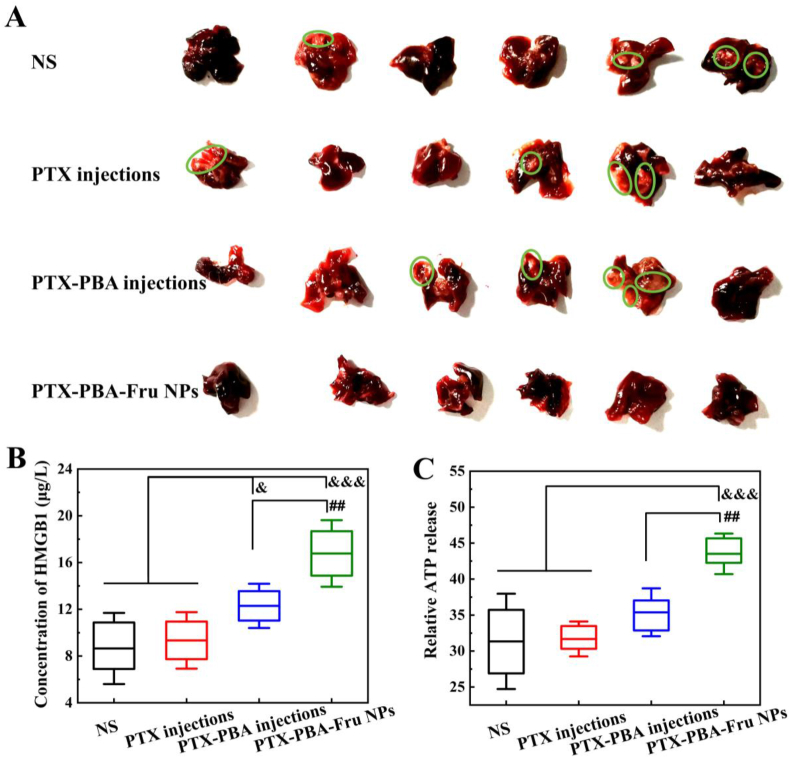
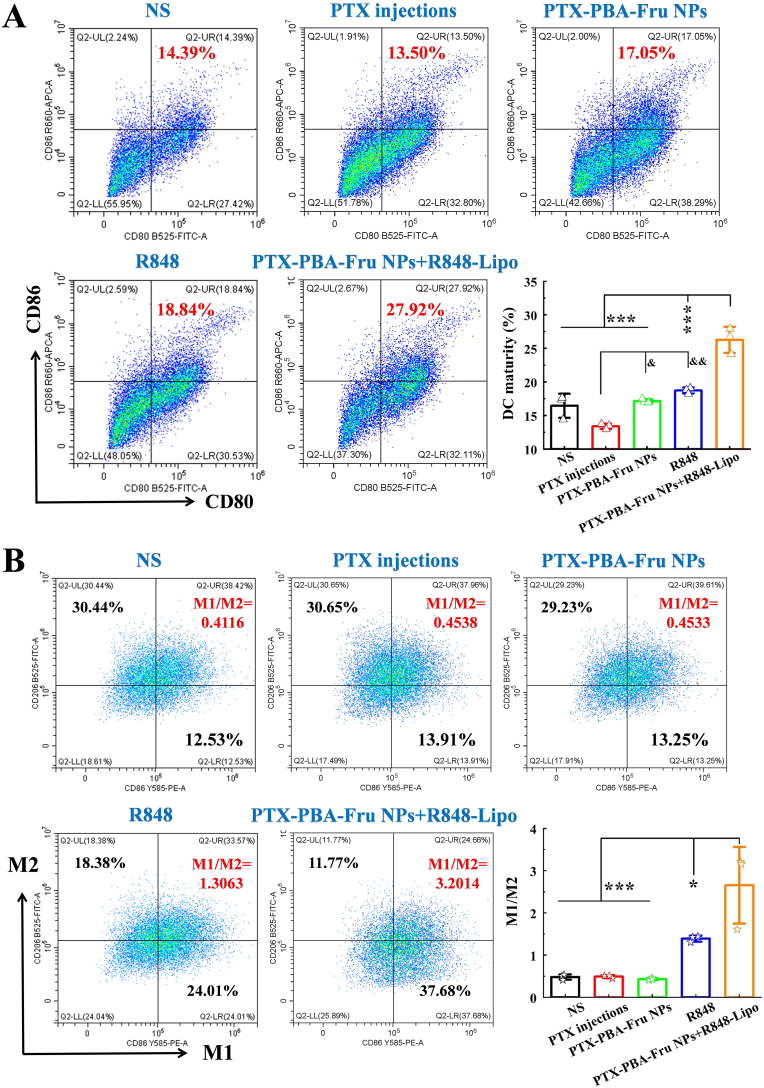
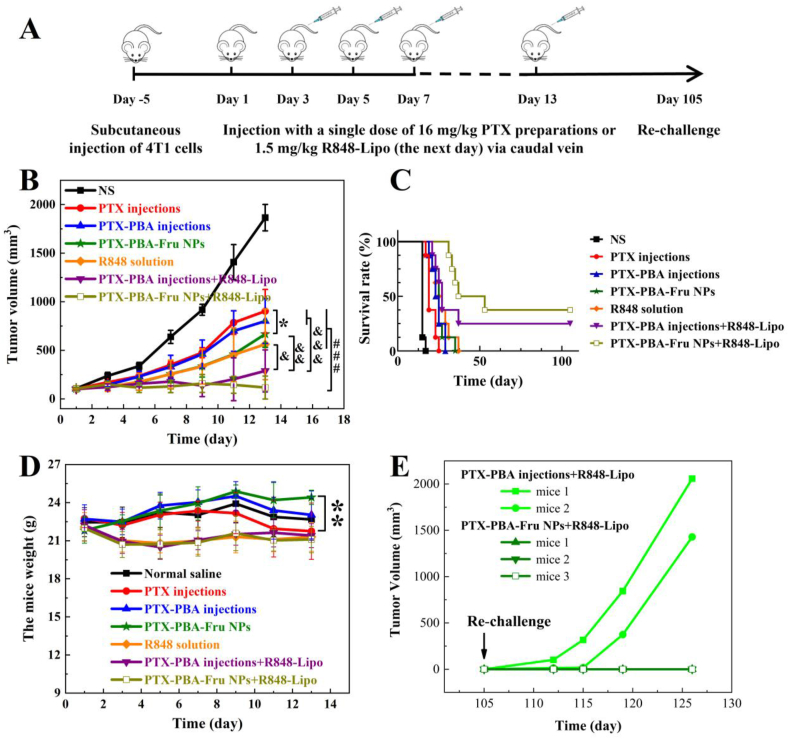
Immunotherapy shows promise for tumor control but is limited by low response rates. Paclitaxel (PTX) induces immunogenic cell death (ICD), yet conventional delivery systems face challenges like low drug loading and insufficient intracellular accumulation, reducing ICD efficacy. Small-molecule self-assembled PTX nanoparticles offer a promising solution due to high drug loading and dose delivery. In this study, PTX was conjugated with phenylboronic acid (PBA) to form the derivative PTX-PBA, which spontaneously self-assembled with fructose into nanoparticles (PTX-PBA-Fru NPs). These nanoparticles exhibited a uniform size of 107.8 ± 2.9 nm, a PDI of 0.064 ± 0.042, and a zeta potential of -12.2 ± 0.9 mV, with spherical morphology. In 4T1 tumor-bearing mice, PTX-PBA-Fru NPs significantly enhanced tumor inhibition (p < 0.001) and increased body weight (p < 0.05). No allergic reactions in healthy Balb/c mice and the maximum tolerated intravenous dose reached 200 mg/kg, underscoring its favorable safety profile of PTX-PBA-Fru NPs. The ICD effects induced by PTX-PBA-Fru NPs, when combined with the immunomodulator resiquimod (R848), elicited a robust anti-tumor immune response. This combination therapy effectively remodeled the immunosuppressive tumor microenvironment and achieved a 37.5 % tumor eradication rate. Moreover, it established long-term immune memory, providing protection against tumor re-challenge. This novel PTX formulation demonstrates strong anti-tumor effects, safety, and clinical potential in combination with R848-based immunotherapy.

Keywords: Chemoimmunotherapy; ICD; Paclitaxel derivative; Phenylboronic acid; Resiquimod; Self-assembly.


Conflict of interest statement

The authors declare that they have no known competing financial interests or personal relationships that could have appeared to influence the work reported in this paper.

Figures

Image 1
Illustration of self-assembled nanomedicine inducing immunogenic cell death in combination with immune agonist for improvement of tumor immune-suppressive microenvironment and enhanced anti-tumor efficacy.
Fig. 1
Fig. 1
Synthesis and characterization of PTX-PBA. (A) The synthetic route for PTX-PBA. (B) Drug concentrations of PTX-PBA incubated in rat blank plasma or liver homogenate (n = 3, mean ± SD). (C) PTX-PBA disrupted microtubule arrangement, inhibited mitosis, and induced cell apoptosis (scale bar, 200 μm).
Fig. 2
Fig. 2
Mechanism of self-assembly of PTX-PBA-Fru NPs. (A) Schematic representation of the self-assembly process of PTX-PBA-Fru NPs. (B) Driving forces behind self-assembly: 1) The pH-responsive dynamic borate ester bond (verified by TLC and 11B-NMR); 2) Hydrogen bonds formed between PTX-PBA and PTX-PBA/Fru, as well as the π-π interactions between PTX-PBA molecules, simulated using Chem 3D. (C) Weak interactions among PTX-PBA + Fru, PTX-PBA-Fru dimer, and PTX-PBA dimer were analyzed using the Independent Gradient Model (IGM).
Fig. 3
Fig. 3
Characterization of PTX-PBA-Fru NPs. (A) Particle size distribution and (B) TEM image of PTX-PBA-Fru NPs (scale bar, 200 nm). (C) XRD patterns of PTX-PBA bulk powder, fructose granules, physical mixture, and the lyophilized powder of PTX-PBA-Fru NPs. (D) The particle size and PDI value of PTX-PBA-Fru NPs in 5 % glucose and plasma (n = 3, mean ± SD). (E) The drug release behavior of PTX-PBA-Fru NPs (n = 3, mean ± SD). (F) In vitro cytotoxicity of PTX injections, PTX-PBA injections, PTX-PBA-Fru NPs and PBA solution against 4T1 cells over 72 h.
Fig. 4
Fig. 4
In vivo anti-tumor efficacy of PTX-PBA-Fru NPs in 4T1 tumor-bearing mice. (A) Schematic diagram illustrating the process of the in vivo experiment. (B) Changes in tumor volume during administration (n = 6, error bars, SD). ∗∗∗p < 0.001 compared to PTX injections; &&p < 0.01 compared to PTX-PBA injections (one-way ANOVA followed by Least-Significant Difference). (C) Tumor images from different treatment groups. (D) Changes in body weight of mice during administration (n = 6, mean ± SD). ∗p < 0.05 (one-way ANOVA followed by Least-Significant Difference). (E) Organ indexes for different groups. Data are presented as mean ± SD. !p < 0.05, !!p < 0.01, vs NS (one-way ANOVA followed by Least-Significant Difference). (F) Serum ALT and AST levels (n = 3, mean ± SD). The results were non-significant. (G) Sialic acid concentrations in serum (n = 3). Error bars, SD. #p < 0.05, ##p < 0.01 (one-way ANOVA followed by Least—Significant Difference).
Fig. 5
Fig. 5
The potential ability of PTX-PBA-Fru NPs to inhibit tumor metastasis by inducing immunogenic cell death (ICD). (A) Comparative analysis of pulmonary metastasis in mice among different treatment groups (n = 6). (B) Serum levels of high mobility group protein B1 (HMGB1, n = 3). (C) Adenosine triphosphate (ATP) levels in the cell culture medium (n = 3). Data are presented as mean ± SD. Statistical significance is indicated with &p < 0.05, &&&p < 0.001, ##p < 0.01, using one-way ANOVA followed by Least-Significant Difference.
Fig. 6
Fig. 6
Immunological analysis in vitro (n = 3). (A) Flow cytometry analysis and quantification of CD80 and CD86 double-positive DC cells. (B) Flow cytometry analysis of M1 macrophages (CD86+ CD206-) and M2 macrophages (CD86- CD206+) in BMDM cells following various treatments and the corresponding ratio of M1/M2. Data are presented as mean ± SD. Statistical significance is indicated as &p < 0.05, &&p < 0.01 vs PTX injections; ∗p < 0.05, ∗∗∗p < 0.001 vs PTX-PBA-Fru NPs + R848-Lipo (one-way ANOVA followed by Tukey's multiple comparisons test).
Fig. 7
Fig. 7
Anti-tumor efficacy of PTX-PBA-Fru NPs combined with R848-Lipo in 4T1 tumor-bearing mice (n = 8). (A) Schematic diagram of the experimental procedure. (B) Changes in tumor volume over time during administration. Error bars, SD. ∗p < 0.05, vs PTX-PBA-Fru NPs; &p < 0.05, &&p < 0.01, &&&p < 0.001, vs PTX-PBA injections + R848-Lipo; ###p < 0.001, vs PTX-PBA-Fru NPs + R848-Lipo (one-way ANOVA followed by Least-Significant Difference). (C) The survival rate of mice in each group. (D) Changes in body weight of mice during administration. Error bars, SD. ∗∗p < 0.01 (one-way ANOVA followed by Least-Significant Difference). (E) Mice cured of primary 4T1 tumors were re-challenged with a subcutaneous injection of 2 × 106 4T1 cells. Tumor volume was measured for three weeks.
Fig. 8
Fig. 8
Analysis of immune activation in vivo. (A)‌ Flow cytometry plots and (B) levels of CD3+, CD4+, and CD8+ T cell infiltration, as well as the M1 to M2 macrophage ratio in tumor tissues (n = 3). ∗p < 0.05, ∗∗p < 0.01, &p < 0.05 (Median test or the independent samples t-test) (C) Immunofluorescence staining of iNOS (M1, red) and CD206 (M2, green) in tumor tissues (scale bar, 200 μm and 50 μm, respectively). (D) Serum levels of IL-12 and TNF-α after various treatments (n = 3). ∗p < 0.05, ∗∗p < 0.01, ∗∗∗p < 0.001; &p < 0.05, &&p < 0.01, &&&p < 0.001; #p < 0.05, ##p < 0.05 (one-way ANOVA followed by Least-Significant Difference) (E)‌ Flow cytometry plots and (F) levels of CD3+ and memory T cells (CD44+CD62L+) in the spleen (n = 3). Error bars represent SD. Statistical significance: ∗p < 0.05, ∗∗p < 0.01 (Kruskal-Wallis test). (For interpretation of the references to color in this figure legend, the reader is referred to the Web version of this article.)

Similar articles

References

    1. Alqahtani F.Y., Aleanizy F.S., El Tahir E., Alkahtani H.M., AlQuadeib B.T. Paclitaxel, profiles drug subst excip. Relat Methodol. 2019;44:205–238. doi: 10.1016/bs.podrm.2018.11.001. - DOI - PubMed
    1. Zhang S., Ye T., Liu Y., Hou G., Wang Q., Zhao F., et al. Research advances in clinical applications, anticancer mechanism, total chemical synthesis, semi-synthesis and biosynthesis of paclitaxel. Molecules. 2023;28 doi: 10.3390/molecules28227517. - DOI - PMC - PubMed
    1. Nehate C., Jain S., Saneja A., Khare V., Alam N., Dubey R.D., et al. Paclitaxel formulations: challenges and novel delivery options. Curr. Drug Deliv. 2014;11:666–686. doi: 10.2174/1567201811666140609154949. - DOI - PubMed
    1. Sofias A.M., Dunne M., Storm G., Allen C. The battle of "nano" paclitaxel. Adv. Drug Deliv. Rev. 2017;122:20–30. doi: 10.1016/j.addr.2017.02.003. - DOI - PubMed
    1. Koudelka S., Turánek J. Liposomal paclitaxel formulations. J Control Release. 2012;163:322–334. doi: 10.1016/j.jconrel.2012.09.006. - DOI - PubMed

LinkOut - more resources