. 2025 Apr 23:32:101797.
doi: 10.1016/j.mtbio.2025.101797. eCollection 2025 Jun.

A biomimetic nanomedicine alleviates liver transplant-related biliary injury by sequentially inhibiting oxidative stress and regulating macrophage polarization via Nrf-2/HO-1 and JNK pathways

Affiliations

A biomimetic nanomedicine alleviates liver transplant-related biliary injury by sequentially inhibiting oxidative stress and regulating macrophage polarization via Nrf-2/HO-1 and JNK pathways

Tian Dong et al. Mater Today Bio. .

Abstract

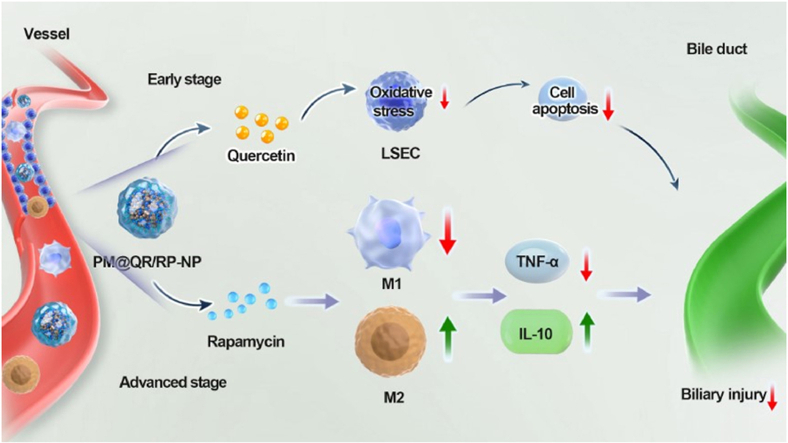
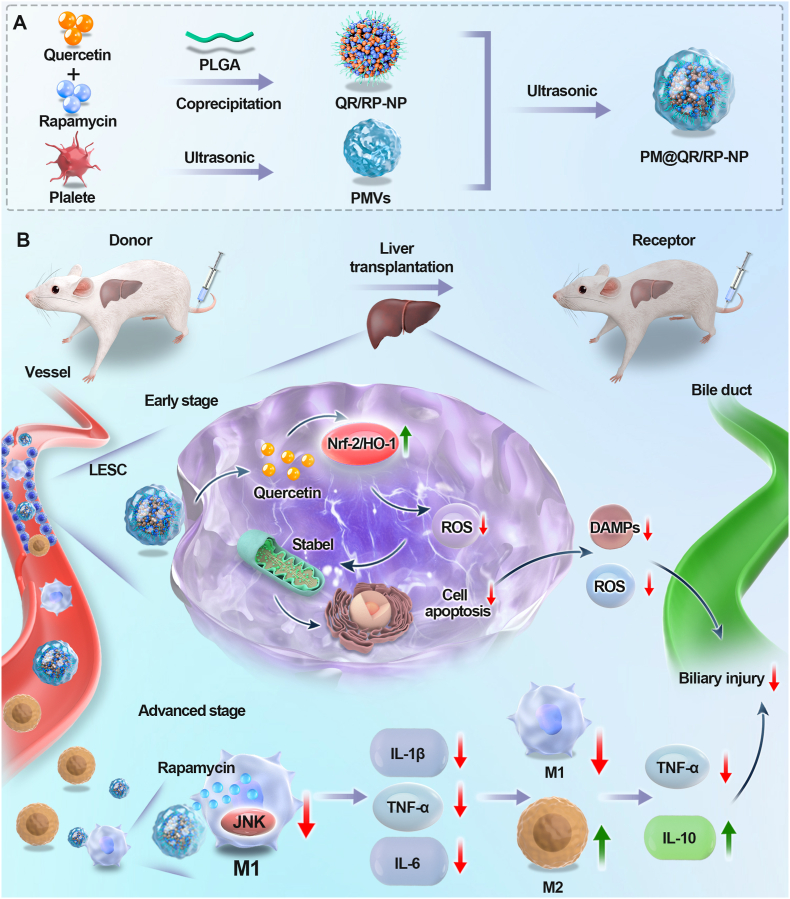
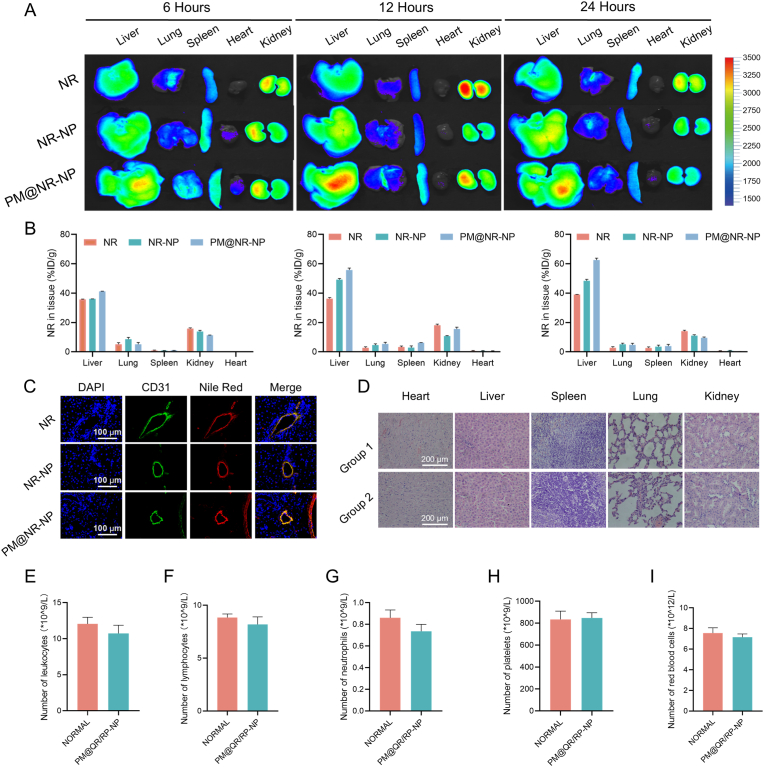
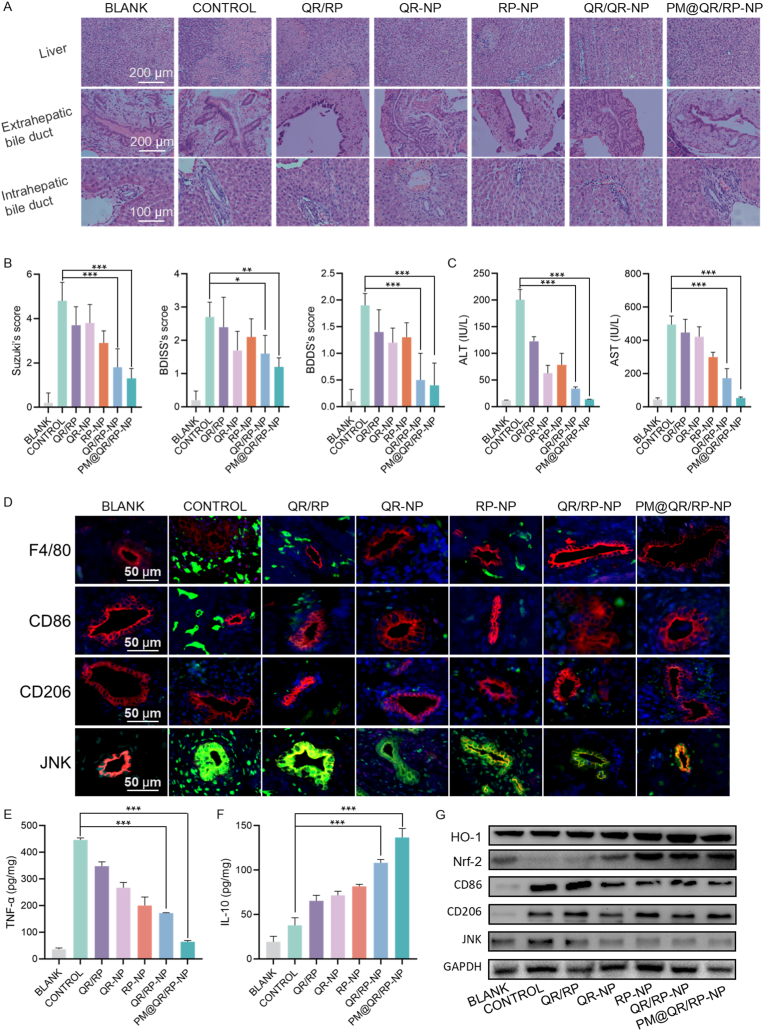
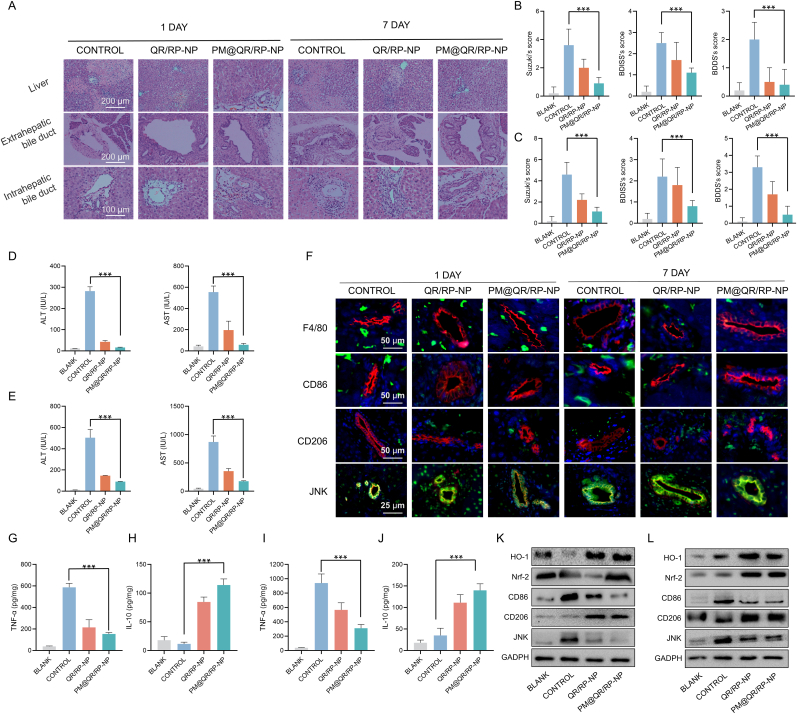
Liver transplantation is an effective method for treating end-stage liver disease. However, 10-20 % of liver transplantation patients develop biliary injury, the main cause of which is ischemia-reperfusion injury (IRI), which consists of oxidative stress injury in the early stage and inflammatory injury in the advanced stage. Biliary injury seriously affects patient outcomes and even leads to mortality, and there are few effective treatments for IRI. Herein, nanoparticles containing quercetin (QR) and rapamycin (RP) coated with poly (lactic-co-glycolic acid) (PLGA) and encapsulated by platelet membrane (PM) were designed to treat IRI in the liver transplantation. The specific binding of ICAM-1 expressed on the PM to integrins (e.g., LFA-1 and Mac-1) in damaged vascular endothelial cells, as well as the interaction between P-selectin on the platelet surface and PSGL-1 on the macrophage surface, allows the accumulation of these biomimetic cell membrane-encapsulated nanoparticles, and subsequently, the delivery of both drugs, to ischemia-reperfusion sites in the liver. The encapsulated QR alleviated oxidative stress injury by activating the Nrf-2/HO-1 signaling pathway in the early stage in model rats with IRI and liver transplantation models. Moreover, RP alleviated inflammatory damage in the advanced stage by suppressing the JNK signaling pathway in M1 macrophages. Thus, these biomimetic nanoparticles that intervene in IRI to alleviate both the early oxidative stress and the advanced inflammatory response constitute a novel delivery system for managing biliary injury after liver transplantation.

Keywords: Biliary injury; Biomimetic nanoparticles; JNK signaling pathway; Liver transplantation; Nrf-2/HO-1 signaling pathway.


Conflict of interest statement

The authors declare no conflict of interest.

Figures

Image 1
Graphical abstract
Scheme 1
Scheme 1
Schematic illustration of the PM@QR/RP-NP preparation (Scheme A). The expression of the Nrf-2/HO-1 signaling pathway is enhanced by using quercetin to clear ROS and maintain mitochondrial stability, thereby alleviating oxidative stress damage to endothelial cells in the early stage of IRI. In the middle and late stages of IRI, rapamycin is used to reduce the JNK signaling pathway in M1 macrophages, alleviating the effects of inflammatory factors on the inflammatory microenvironment and promoting macrophage polarization to M2, thereby solving the long-term inflammatory damage caused by excessive release of inflammatory factors by synergistic treatment to alleviate biliary complications after liver transplantation (Scheme B).
Fig. 1
Fig. 1
Clinical features and characteristics of biliary injury after liver transplantation and characterization of PM@QR/RP-NP. A) GO enrichment analysis of differentially expressed genes in non-anastomotic biliary stricture after liver transplantation compared with patients who did not develop non-anastomotic biliary strictures. B) Size distribution analysis of QR/RP-NP, PMVs, and PM@QR/RP-NP. C) TEM microscopic photos showing the morphology of QR/RP-NP, PMVs, and PM@QR/RP-NP (Scale bar = 200 nm). D) ζ-potential of QR/RP-NP, PMVs, and PM@QR/RP-NP. E) Coomassie brilliant blue stained SDS-PAGE gel images of QR/RP-NP, PMVs, and QR@RP/RP-NP. F) Western blot images of CD34 and CD42b in PM@QR/RP-NP, QR/RP-NP, and PMVs. G) Release curves of QR from QR-NP and PM@QR-NP in buffers of pH 7.4 and pH 5.0. H) Release curves of RP from RP-NP and PM@RP-NP in buffers of pH 7.4 and pH 5.0. I) ABST clearance activity of QR/RP and PM@QR/RP-NP. J) SOD activity of QR/RP and PM@QR/RP-NP. K) Hemolysis test results of QR/RP, QR-NP, RP-NP, QR/RP-NP, and PM@QR/RP-NP. Data are presented as mean ± SEM. (For interpretation of the references to color in this figure legend, the reader is referred to the Web version of this article.)
Fig. 2
Fig. 2
Cellular uptake and antioxidant stress ability of PM@QR/RP-NP. A) Intracellular colocalization of the PM@NR-NP (Nile red is red, lysosomes are green, nuclei are blue) (Scale bar = 50 μm). B) Effects of nanoparticle on ECs viability evaluated by CCK-8 assay (n = 3). C) Fluorescence figures of ECs stained with DCFH-DA (green) (Scale bar = 100 μm), JC-1 (the J-aggregates is red, JC-1 monomer is green) (Scale bar = 25 μm), and TUNEL (green) (Scale bar = 200 μm). Quantitative analysis of relative intensity fluorescence of (D) DCFH-DA, (E) JC-1, and (F) TUNEL in Fig. 2C. H) Flow cytometry analysis of ECs after various treatments. I) Western blot analysis showing the expression of HO-1, Nrf-2 in ECs after various treatments. Data presented as mean ± SEM. ∗p < 0.05, ∗∗p < 0.01, ∗∗∗p < 0.001. (For interpretation of the references to color in this figure legend, the reader is referred to the Web version of this article.)
Fig. 3
Fig. 3
Regulate macrophage polarization and inhibit inflammation of PM@QR/RP-NP in vitro. A) Fluorescence images of CD86 (green), CD206 (red), and DAPI (blue) labeled RAW264.7 cells after different treatments. (Scale bar = 50 μm) Quantitative immunofluorescence staining analysis of (B) CD86 and (C) CD206 expression in Fig. 3A. Flow cytometry analysis of (D) CD86 and (E) CD206 positive RAW264.7 cells after different treatments. Quantitative analysis of (F) CD86 and (G) CD206 positive macrophages in flow cytometry analysis. H) Western blot analysis of CD86, CD206, and JNK expression in RAW264.7 cells after different treatments. ELISA analysis of (I) TNF-α and (J) IL-10 expression in RAW264.7 cells after different treatments (n = 3). Data are presented as mean ± SEM. ∗p < 0.05, ∗∗p < 0.01, ∗∗∗p < 0.001. (For interpretation of the references to color in this figure legend, the reader is referred to the Web version of this article.)
Fig. 4
Fig. 4
Distribution and biocompatibility of the PM@QR/RP-NP in vivo A) Ex vivo imaging of the main organs from rats receiving liver transplantation at 6, 12 and 24 h after intravenous injection of NR, NR-NP and PM@NR-NP. B) Quantification of the fluorescence intensities of the organs in Fig. 4A. C) Immunofluorescence staining images of CD31 (green), and Nile Red (red) in the liver tissues of rats (Scale bar = 100 μm). D) H&E staining image of the major organs 3 days after intravenous administration (Group 1 is normal group, Group 2 is PM@QR/RP-NP group, Scale bar = 200 μm). The number of (E) leukocyte, (F) lymphocyte, (G) neutrophil, (H) red blood cell, (I) blood platelet between the normal and PM@QR/RP-NP group (n = 5). Data presented as mean ± SEM. (For interpretation of the references to color in this figure legend, the reader is referred to the Web version of this article.)
Fig. 5
Fig. 5
Alleviation of oxidative stress and modulating macrophage polarization in the PM@QR/RP-NP-treated IRI rats. A) H&E staining images of liver tissue (Scale bar = 200 μm), extrahepatic bile duct (Scale bar = 200 μm) duct and intrahepatic bile (Scale bar = 100 μm). B) Suzuki, BDISS and BDDS score of liver, intrahepatic bile duct and Extrahepatic bile duct injury (n = 5). C) Effects of various treatments on serum ALT and AST levels (n = 3). D) Immunofluorescence staining images of F4/80 (green), CD86 (green), CD206 (green), JNK (green), and CK7 (red) in the intrahepatic bile duct tissues of IRI and healthy rats after different treatment (Scale bar = 50 μm). Changes in (E) TNF-α and (F) IL-10 levels in the liver tissues of IRI and healthy rats after different treatments, respectively (n = 5). G) WB analysis showing the expression of antioxidation-related and modulating macrophage polarization proteins in IRI rats after various treatments. Data presented as mean ± SEM. ∗p < 0.05, ∗∗p < 0.01, ∗∗∗p < 0.001. (For interpretation of the references to color in this figure legend, the reader is referred to the Web version of this article.)
Fig. 6
Fig. 6
Alleviation of oxidative stress and modulating macrophage polarization in the PM@QR/RP-NP-treated liver transplantation rat. A) Liver tissue (Scale bar = 200 μm), extrahepatic bile duct (Scale bar = 200 μm) and intrahepatic bile duct (Scale bar = 100 μm) analysis using H&E staining in each group on the 1st and 7th day after liver transplantation. Suzuki, BDISS and BDDS score of liver, intrahepatic bile duct and extrahepatic bile duct injury on the (B) 1st and (C) 7th day after liver transplantation (n = 5). Effects of various treatments on serum ALT and AST levels on the (D) 1st and (E) 7th day (n = 3). F) Immunofluorescence staining images of F4/80 (green), CD86 (green), CD206 (green), JNK (green) and CK7 (red) in the intrahepatic bile duct tissues of liver transplantation rats after different treatment (Scale bar = 50 μm). (G) TNF-α and (H) IL-10 levels in the liver tissues of liver transplantation and healthy rats after different treatments on the 1st day (n = 5). (I) TNF-α and (J) IL-10 levels in the liver tissues of liver transplantation and healthy rats after different treatments on the 7th day (n = 5). WB analysis showing the expression of antioxidation-related and modulating macrophage polarization proteins in liver transplantation rats after various treatments on the (K) 1st and (L) 7th day. Data presented as mean ± SEM. ∗p < 0.05, ∗∗p < 0.01, ∗∗∗p < 0.001. (For interpretation of the references to color in this figure legend, the reader is referred to the Web version of this article.)

Similar articles

References

    1. Sousa Da Silva R.X., Weber A., Dutkowski P., Clavien P. Machine perfusion in liver transplantation. Hepatology. 2022;76:1531–1549. doi: 10.1002/hep.32546. - DOI - PubMed
    1. Jung D.-H., Ikegami T., Balci D., Bhangui P. Biliary reconstruction and complications in living donor liver transplantation. Int. J. Surg. 2020;82:138–144. doi: 10.1016/j.ijsu.2020.04.069. - DOI - PubMed
    1. Magro B., Tacelli M., Mazzola A., Conti F., Celsa C. Biliary complications after liver transplantation: current perspectives and future strategies. Hepatobiliary Surg. Nutr. 2021;10:76–92. doi: 10.21037/hbsn.2019.09.01. - DOI - PMC - PubMed
    1. Samstein B., Smith A.R., Freise C.E., Zimmerman M.A., Baker T., Olthoff K.M., Fisher R.A., Merion R.M. Complications and their resolution in recipients of deceased and living donor liver transplants: findings from the A2ALL cohort study. Am. J. Transplant. 2016;16:594–602. doi: 10.1111/ajt.13479. - DOI - PMC - PubMed
    1. Hirao H., Nakamura K., Kupiec-Weglinski J.W. Liver ischaemia–reperfusion injury: a new understanding of the role of innate immunity. Nat. Rev. Gastroenterol. Hepatol. 2022;19:239–256. doi: 10.1038/s41575-021-00549-8. - DOI - PubMed

LinkOut - more resources