

Mammalian Browsers Disrupt Eco-Evolutionary Dynamics in a Forest Tree Restoration Planting
- PMID: 40343225
- PMCID: PMC12059210
- DOI: 10.1111/eva.70099
Mammalian Browsers Disrupt Eco-Evolutionary Dynamics in a Forest Tree Restoration Planting
Abstract
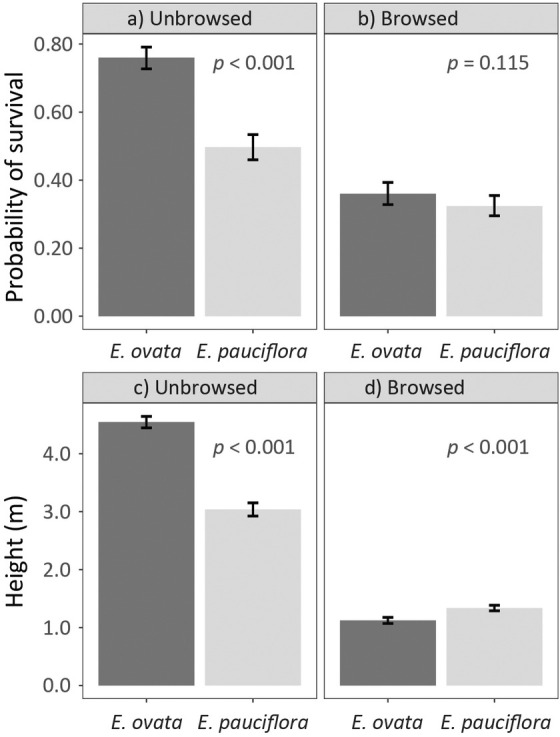
Native and restored forests are increasingly impacted by pests and diseases, including large herbivores. While community- and species-level impacts of these tree enemies are often well-documented, there is little understanding of their influence on finer-scale eco-evolutionary processes. We here study the influence of large-mammal herbivory on the survival and height growth of trees in a mixed species restoration planting of the Australian forest trees, Eucalyptus ovata and E. pauciflora, in Tasmania, Australia. Common-garden field trials mixing the two species were compared in adjacent unbrowsed (fenced) and browsed (unfenced) plantings. The browsed planting was exposed to mammal browsing by native marsupials, as well as feral introduced European fallow deer (Dama dama). Each tree species was represented by open-pollinated families from 22 paired geographic areas, allowing the assessment of the effects of browsing on the species and population differences, as well as on family variation within each species. In the browsed planting, a marked reduction in species and population differences, as well as in family variance, was observed for both height growth and survival. The pattern of height growth and survival of the populations of both species also differed between browsing regimes, with significant changes of climate relationships involving both focal tree attributes detected. Our results argue for a major disruption of the eco-evolutionary dynamics of restored forests in the presence of browsing by large mammalian herbivores, at the observed period of the tree life cycle. Importantly for forest restoration and conservation in the face of global change, our results challenge the choice of tree populations for translocation based solely on predicted or observed relationships of their home-site climate with current and predicted future climates of the restoration sites, while emphasising the need for genetic diversity to provide future resilience of restored forests to both biotic and abiotic stresses.
Keywords: assisted migration; climate adaptation and modelling; differentiation of tree species and provenances; family variance; herbivore‐plant interactions; tree survival and height growth.
© 2025 The Author(s). Evolutionary Applications published by John Wiley & Sons Ltd.
Conflict of interest statement
The authors declare no conflicts of interest.
Figures


Similar articles
-
Unintended consequences of invasive predator control in an Australian forest: overabundant wallabies and vegetation change.PLoS One. 2013 Aug 21;8(8):e69087. doi: 10.1371/journal.pone.0069087. eCollection 2013. PLoS One. 2013. PMID: 23990879 Free PMC article.
-
Tree diversity promotes growth of late successional species despite increasing deer damage in a restored forest.Ecology. 2020 Aug;101(8):e03063. doi: 10.1002/ecy.3063. Epub 2020 May 29. Ecology. 2020. PMID: 32239510
-
Exotic weeds and fluctuating microclimate can constrain native plant regeneration in urban forest restoration.Ecol Appl. 2017 Jun;27(4):1268-1279. doi: 10.1002/eap.1520. Epub 2017 Apr 10. Ecol Appl. 2017. PMID: 28182314
-
Assessing the consequences of global change for forest disturbance from herbivores and pathogens.Sci Total Environ. 2000 Nov 15;262(3):263-86. doi: 10.1016/s0048-9697(00)00528-3. Sci Total Environ. 2000. PMID: 11087032 Review.
-
European forests under global climate change: Review of tree growth processes, crises and management strategies.J Environ Manage. 2023 Apr 15;332:117353. doi: 10.1016/j.jenvman.2023.117353. Epub 2023 Jan 28. J Environ Manage. 2023. PMID: 36716544 Review.
References
-
- Abram, N. J. , McGregor H. V., Tierney J. E., Evans M. N., McKay N. P., and Kaufman D. S.. 2016. “Early Onset of Industrial‐Era Warming Across the Oceans and Continents.” Nature 536, no. 7617: 411–418. - PubMed
-
- Agrawal, A. A. 2020. “A Scale‐Dependent Framework for Trade‐Offs, Syndromes, and Specialization in Organismal Biology.” Ecology 101, no. 2: e02924. - PubMed
-
- Alfaro, R. I. , Fady B., Vendramin G. G., et al. 2014. “The Role of Forest Genetic Resources in Responding to Biotic and Abiotic Factors in the Context of Anthropogenic Climate Change.” Forest Ecology and Management 333: 76–87.
LinkOut - more resources
Full Text Sources
