. 2025;1(1):3.
doi: 10.1038/s44400-025-00011-5. Epub 2025 May 6.

Post-symptomatic NLRP3 inhibition rescues cognitive impairment and mitigates amyloid and tau driven neurodegeneration

Affiliations

Post-symptomatic NLRP3 inhibition rescues cognitive impairment and mitigates amyloid and tau driven neurodegeneration

Anick Auger et al. NPJ Dement. 2025.

Abstract

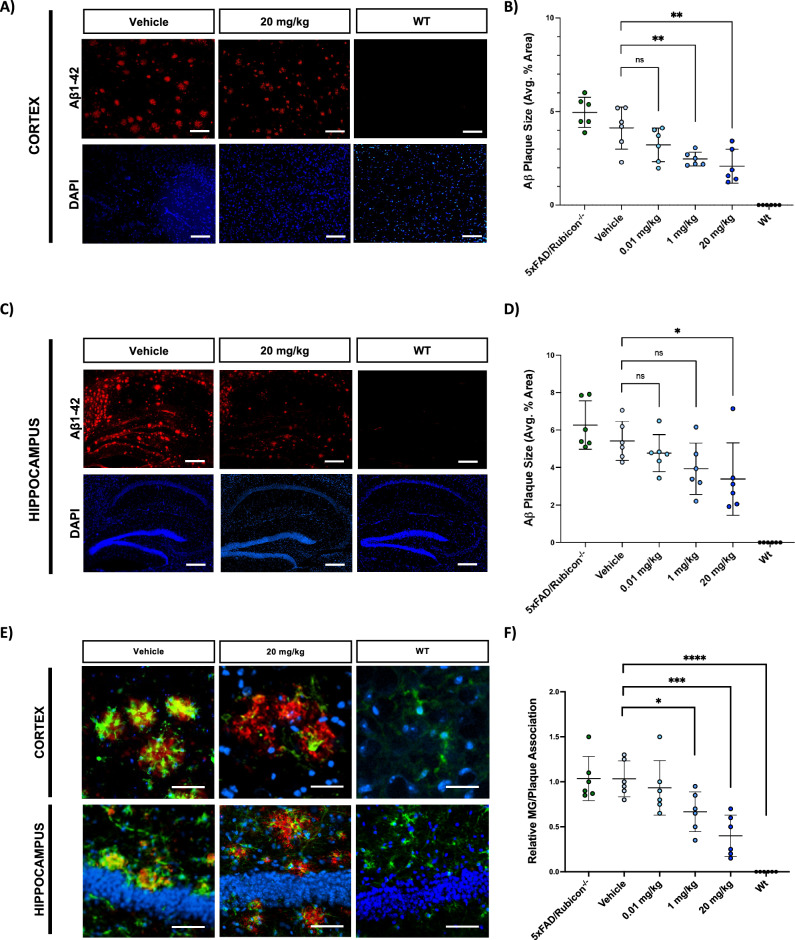
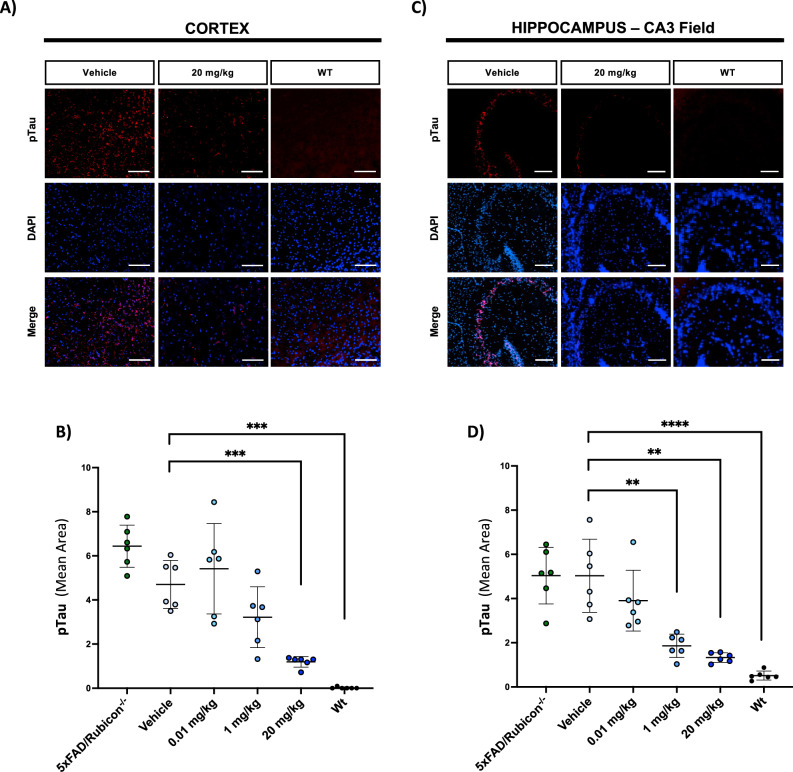
Emerging evidence has established neuroinflammation as a primary driver of progressive neuronal loss observed across neurodegenerative diseases (NDDs). The NLRP3 inflammasome is a cytosolic immunoprotective danger sensing complex, which when aberrantly activated drives neuroinflammation, propagates amyloid deposition, and neurodegeneration. Herein, we report the therapeutic benefit of NLRP3 inflammasome inhibition in Alzheimer's disease (AD), using a novel and selective brain-penetrant small molecule NLRP3 inhibitor, VEN-02XX, which we profiled in the 5XFAD/Rubicon KO AD model. We demonstrate for the first time that targeting NLRP3, post-symptomatic establishment, rescues cognitive deficits, mitigates neuronal loss, and is sufficient to significantly reduce reactive microgliosis, neuroinflammation and tau pathology. Our data further suggest that pharmacological inhibition of NLRP3, after disease onset, has the potential to reduce cortical and hippocampal amyloid burden. Together, these results highlight the potential for NLRP3 inhibition as a symptomatic and disease modifying therapeutic target for AD pathology and more broadly NDDs.

Keywords: Drug discovery; Immunology; Neurodegeneration; Neurodegenerative diseases; Neuroscience.


Conflict of interest statement

Competing interestsA.A., R.F., R.S., M.-A.G. and A.C. declare they are employees of Ventus Therapeutics, Inc., based in Montreal, Canada, and M.A.C. is an employee of Ventus Therapeutics U.S., Inc., based in Waltham, Massachusetts, USA. M.R. was a former employee at Ventus Therapeutics, Inc., based in Montreal, Canada. Ventus Therapeutics Inc. is a subsidiary of Ventus Therapeutics U.S., Inc., collectively referred to herein as “Ventus”. B.L.H. consults for Ventus and is the co-founder and CSO of Asha Therapeutics.

Figures

Fig. 1
Fig. 1. VEN-02XX is a selective and brain penetrant NLRP3 inhibitor.
A VEN-02XX chemical structure and SPR analysis of VEN-02XX interaction with human NLRP3. BE The half maximal inhibitory concentration (IC50) value is the geometric mean of at least 2 independent experiments (PBMCs n = 3; iPSC-derived microglia n = 5; activity against other nod-like receptors (NLRs) n = 2; mouse whole blood (n = 3). F VEN-02XX total and unbound brain-to-plasma partition coefficient, Kp (0.86) and Kp,uu, (0.39) brain (mouse). Both Kp and Kp,uu were calculated using the area under the curve (AUClast) of a pharmacokinetic study in WT mice following single oral dosing with VEN-02XX at 20 mg/kg.
Fig. 2
Fig. 2. Inhibition of NLRP3 using VEN-02XX reverses cognitive impairment and restores memory in a preclinical model of AD.
A VEN-02XX treatment schematic in 5XFAD/Rubicon KO mice with established AD pathology. Sucrose preference test performed at B 6-weeks and C 9-weeks post-dose initiation. D Spatial working and short-term memory evaluation using Y-maze and E novel object recognition. *p < 0.05, **p < 0.01, ****p < 0.00001.
Fig. 3
Fig. 3. VEN-02XX treatment ameliorates pathological microgliosis.
Evaluation of microglial activation via Iba1 staining in cortex (A) and hippocampus (B), Iba1-green, DAPI-blue. Scale bars, 50 um for (A), 100 um for (B). Quantification of cortical (C) and hippocampal (D) Iba1 mean area. Each point represents the average area measures from 16-fields per image of two slides/animal for all study animals per group (n = 6). Data are presented as mean ± SEM. **p < 0.01, ***p < 0.0001, ****p < 0.00001.
Fig. 4
Fig. 4. VEN-02XX treatment restores homeostatic microglial architecture and reduces neuroinflammation.
A Gross evaluation of microglial morphology via Iba1 staining. Scale bars, 10 um. B Representative 3DMorph skeletal and soma analyses of microglial morphology. C, D Quantification of microglial branch length and soma volume respectively (Each point represents the average measured values for a minimum 400 cells/animal, n = 3 for WT and n = 6 for all other groups). EH Quantification (pg/mL) of hippocampal IL-1β (total), IL-6, IP-10, and TNFα in 5XFAD Rubicon knockout (−/−) mice receiving no treatment (green bars; n = 6), vehicle (light blue bars; n = 5), and 1 mg/kg (medium blue bars; n = 6) or 20 mg/kg VEN-02XX (dark blue bars; n = 6). Wild type (WT) mice receiving no treatment (n = 5) are shown in gray bars. Data are presented as mean ± SEM. *p < 0.05, **p < 0.01, ***p < 0.0001.
Fig. 5
Fig. 5. VEN-02XX treatment reduces amyloid burden and disease-associated plaque localization.
A Representative immunofluorescence imaging for amyloid plaques (red) and DAPI (blue) in cortex. Scale bars, 10 um. B Quantification of cortical amyloid plaque area. C Representative immunofluorescence imaging for amyloid plaques (red) and DAPI (blue) in hippocampus. Scale bars, 100 um. D Quantification of amyloid plaque area in hippocampus. E, F Representative images and quantification evaluating microglial (Iba1-green) association with amyloid plaques (red), DAPI (blue). Scale bars, 20 um. MG/Plaque association was quantified as the co-localization of Iba1 with amyloid and represented as relative to 5xFAD/Rubicon−/−. Data are presented as mean ± SEM. **p < 0.01, ***p < 0.0001, ****p < 0.00001.
Fig. 6
Fig. 6. VEN-02XX treatment limits endogenous tau phosphorylation.
Representative immunofluorescence imaging for pTau S396 (red) and DAPI (blue) in cortex (A) and hippocampus (C). Scale bars, 50 um for (A), 100 um for (C). B, D Quantification of pTau S396 mean area in cortex and hippocampus respectively. Data are presented as mean ± SEM. **p < 0.01, ***p < 0.0001.
Fig. 7
Fig. 7. VEN-02XX treatment restricts neurodegeneration and improves neuronal architecture.
A Representative immunofluorescence imaging of cortical neurons (NeuN—white). Scale bars, 100 um. B Quantification of NeuN + cell count in cortex. C Representative immunofluorescence imaging of hippocampal neurons (NeuN—white). Scale bars, 100 um for top, 10 um for bottom. D Quantification of NeuN + cell count in hippocampus. For cortical and hippocampal NeuN quantification, each point represents the average NeuN+ cell counts from 16-fields per image of two slides/animal for all study animals per group (n = 6). E Measurement of the CA3 and dentate gyrus thickness measured in uM, on NeuN stained sections. F Immunoblot analysis for NeuN expression in hippocampal lysates; (−) animals refer to vehicle dosed 5XFAD/Rubicon KO mice and (+) animals refer to 20 mg/kg VEN-02XX dosed 5XFAD/Rubicon KO mice. G Immunoblot analysis for NeuN expression in cortical lysates; (−) animals refer to vehicle dosed 5XFAD/Rubicon KO mice and (+) animals refer to 20 mg/kg VEN-02XX dosed 5XFAD/Rubicon KO mice. H Quantification of band intensity for NeuN normalized to vinculin for hippocampal samples in F (same protein gel along with MAP2). I Quantification of band intensity for NeuN normalized to vinculin for cortical samples in G (same protein gel along with MAP2). Data are presented as mean ± SEM. **p < 0.01, ***p < 0.0001.
Fig. 8
Fig. 8. VEN-02XX treatment improves key neurostructural marker signatures consistent with neuroprotection.
A Immunoblot analysis for MAP2 expression in hippocampal lysates; (−) animals refer to vehicle dosed 5XFAD/Rubicon KO mice and (+) animals refer to 20 mg/kg VEN-02XX dosed 5XFAD/Rubicon KO mice. B Quantification of band intensity for MAP2 normalized to vinculin for hippocampal samples (same protein gel along with NeuN). C Immunoblot analysis for MAP2 expression in cortical lysates; (−) animals refer to vehicle dosed 5XFAD/Rubicon KO mice and (+) animals refer to 20 mg/kg VEN-02XX dosed 5XFAD/Rubicon KO mice. D Quantification of band intensity for MAP2 normalized to vinculin for cortical samples (same protein gel along with NeuN). E Plasma NfL analysis (n = 6/group). Data are presented as mean ± SEM. *p < 0.05, **p < 0.01, ***p < 0.0001.

References

    1. Ross, C. A. & Poirier, M. A. Protein aggregation and neurodegenerative disease. Nat. Med.10, S10–S17 (2004). - PubMed
    1. Kinney, J. W., et al. Inflammation as a central mechanism in Alzheimer’s disease. Alzheimers Dement.4, 575–590 (2018). - PMC - PubMed
    1. Heneka, M. T. et al. Neuroinflammation in Alzheimer’s disease. Lancet Neurol.14, 388–405 (2015). - PMC - PubMed
    1. Qiao, X., Cummins, D. J. & Paul, S. M. Neuroinflammation-induced acceleration of amyloid deposition in the APPV717F transgenic mouse. Eur. J. Neurosci.14, 474–482 (2001). - PubMed
    1. Philippens, I. H. et al. Acceleration of amyloidosis by inflammation in the amyloid-beta marmoset monkey model of Alzheimer’s disease. J. Alzheimers Dis.55, 101–113 (2017). - PMC - PubMed

LinkOut - more resources