. 2025 Apr 17;28(5):112464.
doi: 10.1016/j.isci.2025.112464. eCollection 2025 May 16.

Single-cell RNA sequencing highlights a significant retinal Müller glial population in dry age-related macular degeneration

Affiliations

Single-cell RNA sequencing highlights a significant retinal Müller glial population in dry age-related macular degeneration

Bing Zeng et al. iScience. .

Abstract

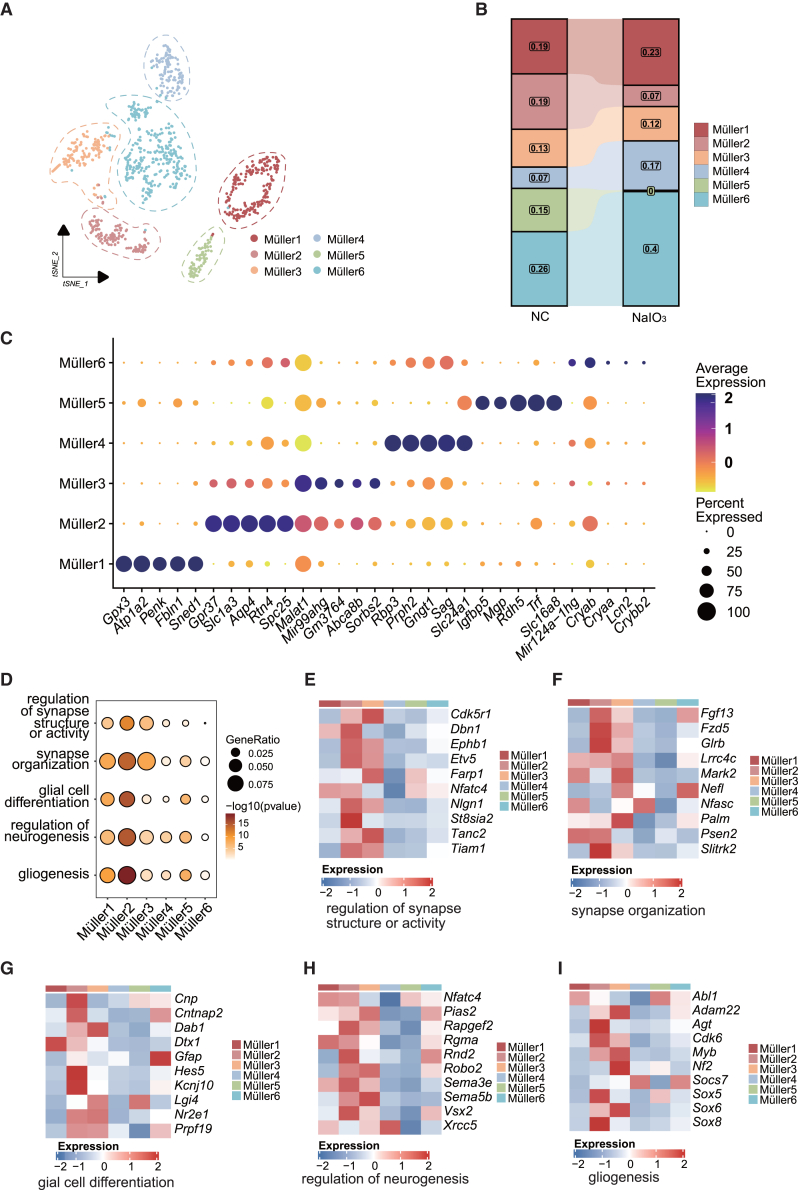
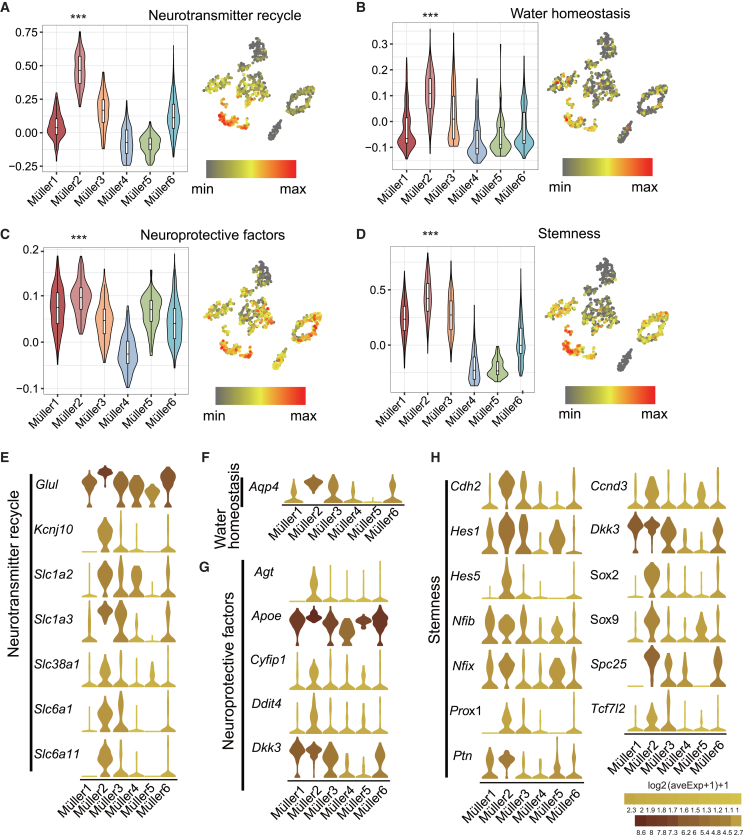
The main challenge in dissecting the cells and pathways involved in the pathogenesis of age-related macular degeneration (AMD) is the highly heterogeneous and dynamic nature of the retinal microenvironment. This study aimed to describe the comprehensive landscape of the dry AMD (dAMD) model and identify the key cell cluster contributing to dAMD. We identified a subset of Müller cells that express high levels of Sox2, which play crucial roles in homeostasis and neuroprotection in both mouse models of AMD and patients with dAMD. Additionally, the number of Sox2+ Müller cells decreased significantly during the progression of AMD, indicating these cells were damaged and underwent cell death. Interestingly, ferroptosis and apoptosis were identified as contributors to the damage of Sox2+ Müller cells. Our findings are potentially valuable not only for advancing the current understanding of dAMD progression but also for the development of treatment strategies through the protection of Müller cells.

Keywords: Pathophysiology; Transcriptomics; complex system biology.


Conflict of interest statement

The authors declare no competing interests.

Figures

None
Graphical abstract
Figure 1
Figure 1
A total of 12 cell types were identified in NaIO3-induced AMD model (A) The workflow of this study. (B) The 12 major cell populations were identified in mice. (C) The UMAP (Uniform Manifold Approximation and Projection) distribution of canonical markers for each cell cluster. (D) Relative changes in cell ratios among different clusters between the NC and SI (NaIO3) groups. (E) The average expression level of the top marker genes across 12 clusters. See also Figure S1.
Figure 2
Figure 2
Müller glia are closely related to AMD (A) The diagram illustrates the strategy for screening AMD risk genes according to specific risk loci of AMD. (B) The violin plot shows the score of AMD-associated genes in ten retinal cell clusters. The box represents median value. (C) The boxplot shows the differences in AMD risk scores across various cell types. (D) The heatmap illustrates the expression levels of 31 AMD-related genes. ∗p < 0.05, ∗∗p < 0.01, ∗∗∗p < 0.001, ∗∗∗∗p < 0.0001, Wilcoxon test.
Figure 3
Figure 3
A distinct subset of Müller glia was identified (A) The t-SNE (t-distributed Stochastic Neighbor Embedding) distribution of six Müller cell clusters resulted from cluster analysis. (B) Relative changes in cell ratios in different clusters between NC and SI (NaIO3) groups of Müller cells. (C) The dot plot shows the mean expression of the preferentially expressed genes in six clusters in Müller cells. (D) GO enrichment analysis of AMD-upregulated DEGs in six Müller glia clusters of the AMD model. (E–I) The heatmap plots show the expression of genes in six Müller glia clusters, which are from regulation of synapse structure or activity (E), synapse organization (F), glial cell differentiation (G), regulation of neurogenesis (H), and gliogenesis (I). See also Figure S3.
Figure 4
Figure 4
Müller 2 cells are featured with retinal homeostasis and neuroprotection (A–D) The left violin plot shows that Müller 2 has a higher score in neurotransmitter recycling (A), maintaining water homeostasis (B), excreting neuroprotective factors (C), and stemness (D) than other Müller glia clusters. The boxes show the median (center line) and the quartile range (25%–75%), and the whiskers extend from the quartile to the minimum and maximum values. The t-SNE distribution of four gene signature scores on the right corresponds to the violin plot, and the cluster circled by the dashed line is Müller cluster 2. The statistic result was calculated by Müller cluster 2 and other Müller glia clusters in pairs, and the minimal statistical significance was labeled above the violin plot. (E–H) The violin plot of high-expression genes in four gene signatures among six Müller glia clusters; genes are colored according to their logarithmic transformation of average expression. ∗p < 0.05, ∗∗p < 0.01,∗∗∗p < 0.001, ∗∗∗∗p < 0.0001, Wilcoxon test. See also Figures S2 and S3.
Figure 5
Figure 5
Ferroptosis and apoptosis are potential mechanisms that can lead to damage in Müller 2 cells (A) The violin plots show the apoptosis score, ferroptosis score, autophagy score, disulfidptosis score, inflammatory score, cuproptosis score, necroptotic score, and pyroptosis score in Müller2 between NC (blue) and SI (NaIO3, red) groups, and the lines in the boxplot represent the median values of each cluster. The t-SNEs show the distribution and the expression of score related to eight pathways, and the dots colored with gray are non-Müller2 cells. ∗p < 0.05, ∗∗p < 0.01, ∗∗∗p < 0.001, ∗∗∗∗p < 0.0001, Wilcoxon test. (B) GO and pathway enrichment analysis of the upregulated DEGs in Müller2 cells in the NaIO3 group. p value was derived by a hypergeometric test. (C) The GSEA analysis shows ferroptosis (orange) and apoptosis (blue) were enriched in Müller2 cells in the NaIO3-treated group. (D) The GSEA analysis shows ferroptosis (orange) and apoptosis (blue) were enriched in the AMD group of human Müller 4 cluster. (E) The violin plot of markers in Müller 2 cells. (F) The violin plot of markers in Müller 2 cells from the SI (NaIO3) group. The square colored blue indicates NC group, and the square colored red indicates SI (NaIO3) group. (G) Immunofluorescence labeling for glutamine synthetase (GS, green), Sox2 (purple), Keap1 (red), and DAP1 nuclear staining (blue) in the mice retinas. The four graphs on the left represent the control group, while the four graphs on the right represent the NaIO3 group. The graph in the white rectangle is the merge of GS staining, Sox2 staining, and Keap1 staining. Scale bars, 20 μm. GCL, ganglion cell layer; IPL, inner plexiform layer; INL, inner nuclear layer; OPL, outer plexiform layer; ONL, outer nuclear layer. (H) The quantification of GS+ Sox2+ cells (upper panel) and GS+ Sox2+ Keap1+ cells (lower panel) was performed by counting the number of co-stained cells per square 100 μm in 10 fields of the sections from three mice in each group (at least 5 sections coming from 2 to 3 different animals). Error bars represented SD (p values reflected comparison to the control samples). ∗∗∗∗p < 0.001, t test. See also Figures S4 and S5.

Similar articles

References

    1. Rim T.H., Kawasaki R., Tham Y.-C., Kang S.W., Ruamviboonsuk P., Bikbov M.M., Miyake M., Hao J., Fletcher A., Sasaki M., et al. Prevalence and Pattern of Geographic Atrophy in Asia: The Asian Eye Epidemiology Consortium. Ophthalmology. 2020;127:1371–1381. doi: 10.1016/j.ophtha.2020.04.019. - DOI - PubMed
    1. Zeng B., Liu D.C., Huang J.G., Xia X.B., Qin B. PdmIRD: missense variants pathogenicity prediction for inherited retinal diseases in a disease-specific manner. Hum. Genet. 2024;143:331–342. doi: 10.1007/s00439-024-02645-6. - DOI - PubMed
    1. Fleckenstein M., Keenan T.D.L., Guymer R.H., Chakravarthy U., Schmitz-Valckenberg S., Klaver C.C., Wong W.T., Chew E.Y. Age-related macular degeneration. Nat. Rev. Dis. Primers. 2021;7:31. doi: 10.1038/s41572-021-00265-2. - DOI - PubMed
    1. Tan Y., Huang J., Li D., Zou C., Liu D., Qin B. Single-cell RNA sequencing in dissecting microenvironment of age-related macular degeneration: Challenges and perspectives. Ageing Res. Rev. 2023;90 doi: 10.1016/j.arr.2023.102030. - DOI - PubMed
    1. Zauhar R., Biber J., Jabri Y., Kim M., Hu J., Kaplan L., Pfaller A.M., Schäfer N., Enzmann V., Schlötzer-Schrehardt U., et al. As in Real Estate, Location Matters: Cellular Expression of Complement Varies Between Macular and Peripheral Regions of the Retina and Supporting Tissues. Front. Immunol. 2022;13 doi: 10.3389/fimmu.2022.895519. - DOI - PMC - PubMed

LinkOut - more resources