

COVID-19 and the impact of physical activity on persistent symptoms
- PMID: 40343325
- PMCID: PMC12058785
- DOI: 10.3389/fspor.2025.1560023
COVID-19 and the impact of physical activity on persistent symptoms
Abstract
Introduction: Physical activity is protective against chronic disease but whether activity is associated with persistent symptoms in non-hospitalized coronavirus disease 2019 (COVID-19) survivors is unknown. The purpose of the study was to determine the impact of the COVID-19 pandemic on physical activity levels and the influence of physical activity on acute COVID-19 and long COVID symptoms in non-hospitalized COVID-19 survivors.
Methods: In total, 64 non-hospitalized COVID-19 survivors (45 female participants, 40 ± 18 years) were assessed for activity levels, body composition, and symptoms of COVID-19 8.5 ± 4.7 months post-infection and categorized into two groups: (1) persistent symptoms and (2) no symptoms at the time of testing. Furthermore, 43 of the 64 participants (28 female participants, 46 ± 18 years) completed a follow-up questionnaire online 51.0 ± 39.7 months (4.25 years) post-infection. A subset of 22 COVID-19 survivors (16 female participants, 35 ± 16 years) were matched for age, sex, and body mass index with healthy controls. Physical activity was quantified using (1) self-reported questionnaire (International Physical Activity Questionnaire; IPAQ-SF) at three time periods; prior to COVID-19 infection, at the time of laboratory testing (8.5 ± 4.7 months after infection), and during an online follow-up (51.0 ± 39.7 months, i.e., 4.25 years after infection); and (2) 7 days of wearing an ActiGraph accelerometer following laboratory testing.
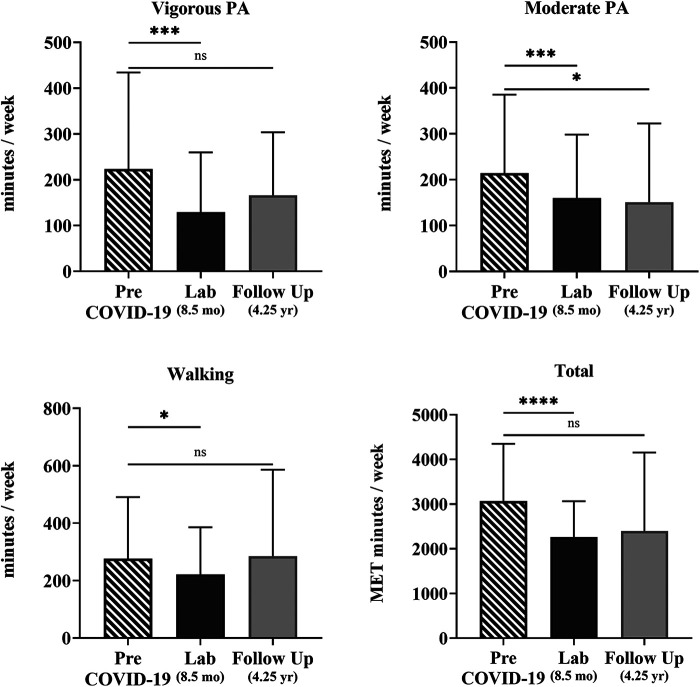
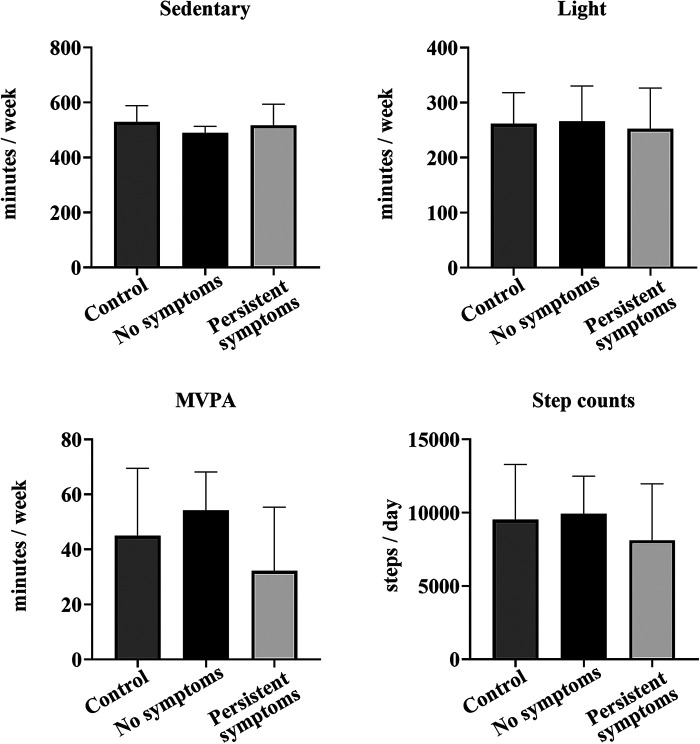
Results: Physical activity (IPAQ-SF) declined in COVID-19 survivors from pre-COVID-19 infection to 8.5 ± 4.7 months after infection [3,656 vs. 2,656 metabolic equivalent of task (MET) min/week, 27% decrease, p < 0.001, n = 64] and rebounded to levels similar to pre-COVID-19 infection at 4.25 years after infection (p = 0.068, n = 43). Activity levels quantified with accelerometry did not differ between COVID-19 survivors and controls. However, COVID-19 survivors who reported persistent symptoms 8.5 months after infection (n = 29) engaged in less moderate-vigorous physical activity and steps/day than those without persistent symptoms (n = 27) (37 vs. 49 MET min/day, p = 0.014 and 7,915 vs. 9,540 steps/day, p = 0.014).
Discussion: Both COVID-19 survivors and matched controls reported reductions in physical activity indicating that lower levels of activity were likely due to the pandemic rather than COVID-19 infection alone. However, those who were most affected by COVID-19 infection with persistent symptoms had the greatest reductions in physical activity, even at ∼8 months and ∼4 years post-infection.
Keywords: COVID-19; accelerometer; fatigue; healthy control; long COVID; persistent symptoms; physical activity.
© 2025 Opielinski, Uhrich, Haischer, Beilfuss, Mirkes Clark, Kroner, Bollaert, Danduran, Piacentine, Hoeger Bement, Papanek and Hunter.
Conflict of interest statement
The authors declare that the research was conducted in the absence of any commercial or financial relationships that could be construed as a potential conflict of interest.
Figures


References
-
- World Health Organization. WHO Director-General's opening remarks at the media briefing on COVID-19–11 March 2020. World Health Organization; (2020). Available at: https://www.who.int/director-general/speeches/detail/who-director-genera... (Accessed October 01, 2024).
-
- World Health Organization. COVID-19 cases | WHO COVID-19 dashboard. datadot (2024). Available at: https://data.who.int/dashboards/covid19/cases (Accessed December 01, 2024).
-
- Centers for Disease Control and Prevention. Coronavirus disease 2019 (COVID-19) - symptoms. CDC; (2024). Available at: https://www.cdc.gov/coronavirus/2019-ncov/symptoms-testing/symptoms.html (Accessed July 10, 2022).
LinkOut - more resources
Full Text Sources
Miscellaneous