[Preprint]. 2025 Apr 28:rs.3.rs-4125909.
doi: 10.21203/rs.3.rs-4125909/v1.

Neural Networks of the Mouse Primary Visceromotor Cortex

Affiliations

Neural Networks of the Mouse Primary Visceromotor Cortex

Hong-Wei Dong et al. Res Sq. .

Update in

  • Neural networks of the mouse visceromotor cortex.
    Hintiryan H, Zhu M, Zhao P, Zhang M, Barry J, Nanda S, Rudd M, Wong A, Miller S, Gou L, Wei J, Zingg B, Sun J, Gutierrez A, Mun HS, Han YE, Bowman I, Garcia L, Lo D, Boesen T, Cao C, Zhao Q, Foster NN, Moradi K, Yamashita S, Estrada C, Dev A, Gonzalez J, Xu H, Yang G, Park CS, Yang XW, Levine MS, Zhang LI, Micevych P, Cepeda C, Golshani P, Hong W, Dong HW. Hintiryan H, et al. Nature. 2025 Aug 27. doi: 10.1038/s41586-025-09360-w. Online ahead of print. Nature. 2025. PMID: 40866707

Abstract

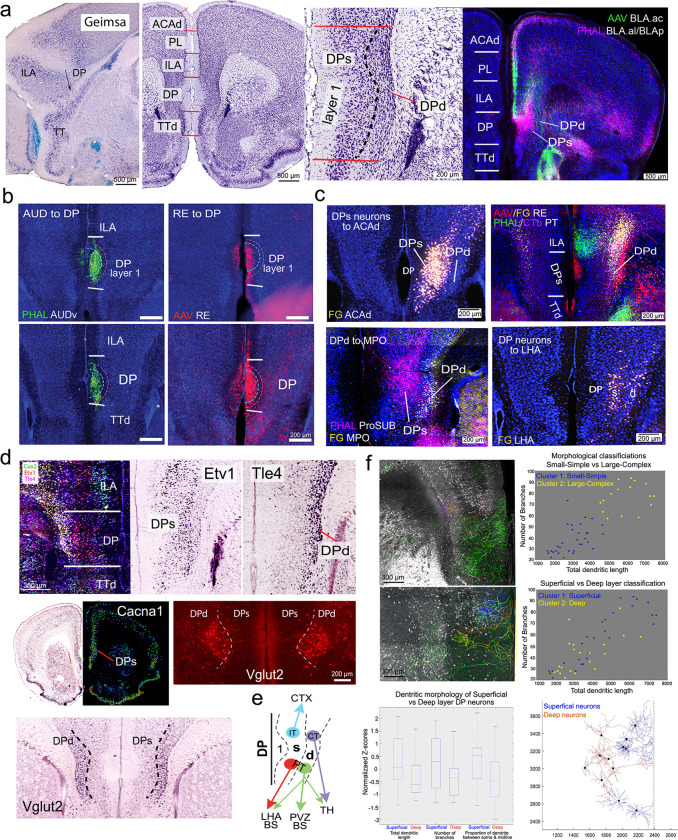
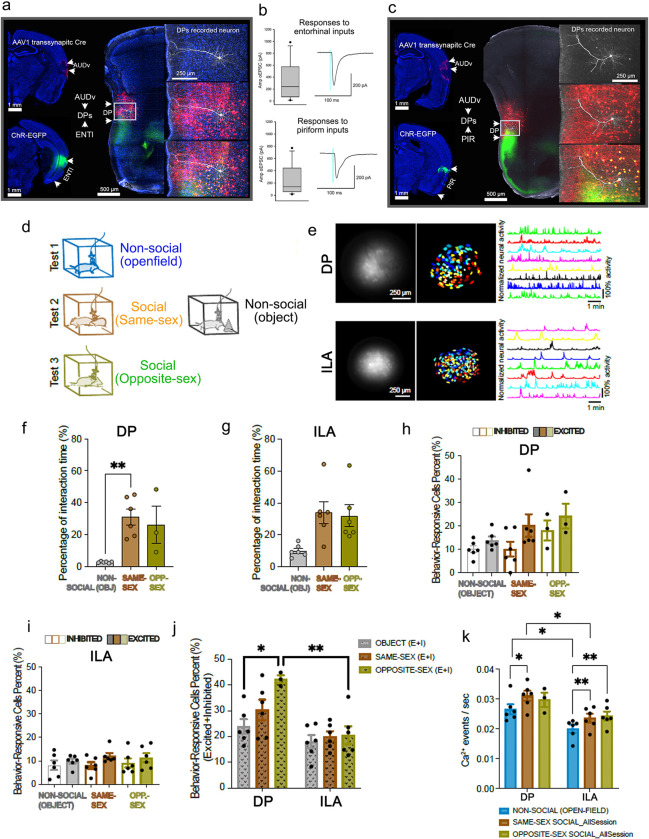
The medial prefrontal cortex (MPF) regulates emotions, stress responses, and goal-directed behaviors like attention and decision-making. However, the precise mechanisms underlying MPF function remain poorly understood, largely due to an incomplete characterization of its neural circuitry. Leveraging neuroanatomical, neurophysiological, and behavioral techniques, we present a detailed wiring diagram of the MPF, with a particular focus on the dorsal peduncular area (DP), an underexplored MPF area implicated in psychological stress, fear conditioning, anxiety, depression, and opioid addiction. Our analysis identifies the deep (DPd) and superficial (DPs) layers of the DP, together with the infralimbic area (ILA), as key components of the primary visceromotor cortex, that generate monosynaptic projections to regulate neuroendocrine, sympathetic, and parasympathetic functions in distinct, yet coordinated ways. Further, we demonstrate that the DP serves as a unique network hub for unidirectional cortical information flow, that integrates diverse cortical inputs and modulates social behavior. Based on the mesoscale connectome of entire MPF, we propose a unified MPF network model that regulates different aspects of motor actions associated with goal-directed behavior. This study provides novel insights into the complex role of the MPF in orchestrating physiological and behavioral responses to environmental stimuli in mammals.


Conflict of interest statement

Additional Declarations: There is NO Competing Interest.

Figures

Figure 1:
Figure 1:. Anatomical delineation of the dorsal peduncular area (DP) and its cell type organization.
a, DP delineation is based on combinatorial Nissl- and Giemsa-stained cytoarchitecture. DP layer 1 appears excessively thick compared to layer 1 of the ILA, PL, ACAv, ACAd, and TTd. Two primary DP sublayers are identified: the superficial layer (DPs) is characterized by relatively larger cell bodies, while the deep layer (DPd) contains densely packed smaller-sized neurons. This cytoarchitectonic feature contrasts with the TTd, which exhibits a darkly stained and densely packed layer 2 but a loosely arranged layer 3. Additionally, DP can be readily distinguished from other MPF areas by its connectivity with the amygdala. The right panel illustrates axonal inputs from the BLAal (magenta, PHAL), which generates dense terminals in the DPs. Conversely, axonal terminals from BLAam (AAV-GFP) densely innervate the ILA, PL, and DPd, but not DPs, thereby delineating the border between DP and ILA (see Extended Data Figure 2e,f for injection sites). b, Connectivity-based parcellation of the DP. Axonal inputs arising from AUDv and RE generate dense terminals in layer 1 of DP, defining the scope of the DP (see Extended Data Fig. 2a, c for injection sites. c,Connectivity-based characterization of DP sublayers. DPs, but not DPd, contains fluorogold (FG) labeled cortical neurons that project to the dorsal anterior cingulate area (ACAd, upper left). Conversely, medial preoptic area (MPO)-projecting neurons are in the DPd (lower left). Thalamic projection neurons are exclusively found in DPd (upper right), while neurons projecting to the lateral hypothalamic area (LHA) are distributed in DPd and the deep portion of DPs (lower right). Aligning with these laminar specificities, axonal projections from ProSUB are densely distributed in DPs but markedly reduced in DPd, creating a visible gap (lower left). Notably, thalamo-MPF axonal projections also exhibit regional and laminar specificity (upper right). Collectively, these connectivity data confirm the regional and laminar delineation of DP (see Extended Data Fig. 2h, j-l for injection sites). d,Regional and laminar specificities of DP are further validated by cell type-specific gene expression (also see Extended Data Fig. 3). The upper left panel displays a representative RNAscope image showing expression of selected marker genes: Cux2 (for cortical layer 2/3 IT cells), Etv1 (for layer 5 IT), and Tle4 (for layer 6 CT). Note that the expression of Cux2 does not extend into the DP, Etv1 is primarily expressed in DPs, while Tle4 extends into DPd (also see Extended Data Fig. 3a). These expression patterns in the DP align with those observed in the Allen Brain Atlas database (www.brain-map.org, right panel) (Extended Data Fig. 3b-g). The expression of a layer 5 marker gene, Cacna1h, is also shown with its expression extending from the neocortex into DPs but not DPd. Further distinguishing DPs from DPd is the expression of VGLUT2 that is illustrated using VGLUT-Cre mice crossed with the Ai14 reporter line and through in situ hybridization. e, Schematic of neuron types in the DPs and DPd. IT (to cortex) and CT (to thalamus) projection neurons are distributed in the DPs or DPd, respectively. DPd also contains PT neurons projecting to the hypothalamic periventricular zone (PVZ), while PT neurons projecting to the lateral hypothalamic area (LHA) and brainstem (BS) are distributed in both DPs and DPd. f, Confocal images of MORF3 labeled DP neurons reveal finely detailed dendritic morphology alongside their digital reconstructions (left panel). Many neurons extend their apical dendrites into layer 1 of DP. Morphological analysis (using k-means clustering) of the dendritic arbors (also see Extended Data Fig. 5) identifies two neuron clusters: Cluster 1 (colored in blue), which included smaller and less complex dendritic arbors (average total dendritic length: 3024 ± 833 μm, average number of branches: 38 ± 12), and Cluster 2 (colored in yellow), which included larger and more complex dendritic arbors (average total dendritic length: 5906 ± 987 μm, average number of branches: 76 ± 12). Considering the distance between soma locations and the brain's midline, we further categorized neurons as either Deepor Superficial. Integration of both classification methods reveal those deep neurons more commonly associate with Cluster 1, hence containing smaller and less complex dendritic arbor neurons, while the superficial neurons are prevalent in both Clusters, and exhibit larger and more complex dendritic wiring. Superficial layer neurons also display a higher proportion of their overall dendritic wiring between their cell bodies and the brain midline compared to the Deep layer neurons. Additionally, from each neuron, the proportions of their dendritic wiring (measured as a fraction of total dendritic length) located between their cell body and the brain midline was also quantified as a representation of overall dendritic orientation. The Superficialneurons contained a greater proportion of dendrites oriented towards the midline compared to the Deep neurons (Superficial: 66 ± 17 % of total dendritic wiring, Deep: 53 ± 17 % of total dendritic wiring, one tailed Wilcoxon Signed-Rank Test, false discovery rate corrected p=0.01). Similarly in corroboration, smaller-simpler neurons of morphological Cluster 1 were deeper (average distance from midline: 472 ± 184 μm) from the midline when compared against the larger-complex neurons of morphological Cluster 2 (average distance from midline: 337 ± 148 μm) neurons (one tailed Wilcoxon Signed-Rank Test, p=0.0099).
Figure 2:
Figure 2:. Connectional input specificities of MPF areas with olfactory cortical areas and the claustrum (CLA).
a, A 2D cluster map highlights the distinctive olfactory inputs to MPF areas and TTd, based on the connectivity data shown in b(for injection sites, see Extended Data Fig. 6). The brightness of the grids corresponds to strength of input. The brighter the grid, the stronger the connection. Numbers 1–4 refer to the corresponding panels of retrograde labeling in different olfactory regions in b. Note the consistency between the raw image data and the results of the clustermap. For example, strongest input to MPF from the COApm (#3) is to the DPd, which is evident from both the clustermap in a and the raw image in b. c-e, Quantitative comparisons of olfactory inputs to different MPF areas from the AON, PIR, and COApm, respectively. f, A quantitative summary of average projections to MPF areas from those olfactory regions. Collectively, these data illustrate distinct connectivity patterns of the TTd, DPs, DPd, and other MPF areas. While TTd (as part of the olfactory cortical area) receives dense inputs from the PIR, AON, and TTv, DPs receives dense inputs from the PIR and AON. DPd uniquely receives dense inputs from the COApm, in addition to other olfactory inputs. ILA also receives weak olfactory inputs, while other MPF areas remain void of olfactory inputs. g, Retrograde labeling in the CLA after CTB or FG injections into the DPd, DPs, ILA, or PL reveals quantitatively distinct connectivity patterns shown in h. DPs receives no inputs from the CLA, whereas DPd, ILA, and PL receive robust inputs from the CLA. Also note the consistency between the raw images and the quantified data. See Extended Data Fig. 11 for connectional output specificities of MPF areas with cortical areas and the CLA.
Figure 3:
Figure 3:. Cortical input/output organization of the DPs, DPd, and other MPF areas
a, Left: Distribution map of cortical neurons projecting to the DPs, DPd, and other MPF areas reconstructed from retrograde tracing experiments. The map shows a broad spectrum of cortical inputs to the DPs and DPd. Right: Bar graph illustrating comparative inputs to the DPs and DPd based on retrograde tracing results. Representative micrographs of CTB labeled DPs or DPd projecting neurons are also shown. See Extended Data Figs. 12–13 for retrograde tracing data and map). All retrograde cases can also be found on the online map (https://brain.neurobio.ucla.edu/mpf/ ; username: guest, password: mpfbrainmap710). b, Using anterograde tract tracing method, we validated quantitatively distinct inputs from ENTl L2/3 to the DPs (originating from Cux2 positive neurons), and from ENTl L5/6 to the DPd. Refer to Extended Data Fig. 14a,b for the validation of inputs to the DP from other structures using anterograde tract tracing method. c, Schematic summary of neuronal inputs to the DPs and DPd from various cortical, amygdalar, and hippocampal structures. d, Quantitative comparison of outputs from and input to the DPs from other MPF areas like the ILA, PL, ACAv, ACAd, as well as from other cortical areas such as ORBm, MOp, and MOs (upper panel). The middle panel shows representative images of PHAL labeled axons originating from the DPs in select cortical areas shown in the bar graph (refer to Extended Data Fig. 6a,b for MPF injection sites). These axons follow two parallel projection pathways traveling through cortical layer 1 and deep layer 5, terminating densely in the ILA, PL, ACAv, ACAd, MOp, and MOs, as well as PTLp, RSPd, and visual cortices (see Extended Data Fig. 14e). The lower panel highlights the sparse distribution of retrogradely CTB labeled neurons in corresponding cortical areas from the same injection sites (see Extended Data Fig. 12a for CTB injection site in DPs). Together, this data show that DPs sends dense projections to, but receives much less inputs from, MPF and motor cortices. e, The schematic illustrates that the DP serves as a network junction, facilitating the transmission of neural inputs from cortical areas within the lateral cortical network , olfactory areas (OLF), amygdala (AMY), and hippocampus (HPF) to other MPF areas, to cortical areas within the medial cortical network , and to cortical motor areas. f. A 2D hierarchical clustering of the MPF-cortex projection fraction matrix reveals several clusters of cortical projection targets of the DPs, DPd, and other MPF areas. Prefrontal (PFC) areas are in the columns to the left of the gray line. Additional clusters are highlighted with colored boxes (Refer to Source Data 1 for Source data).
Figure 4:
Figure 4:. DP projections to brain structures in controlling autonomic outputs
a,PHAL labeled axons originating from the DPs innervate two descending parts of the PVH (PVHd), namely the lateral parvicellular and forniceal parts (PVHlp and PVHf) (a1-a3), which contain spinal projecting neurons revealed by a CTB injection into the spinal cord (a4). Corresponding Nissl stained image (a1) validates cytoarchitecture of the PVHlp and PVHf, which contain VGLUT2 positive neurons (a2, image from Brain-map.org). Refer to Extended Data Fig. 21afor PHAL injection site in DPs. DPs axons densely distribute in the LHA (a5), which also contains CTB labeled spinal projecting neurons (a6). All scale bars = 200 μm. b,Our strategy of uncovering potential synaptic connections between DP axons and hypothalamic spinal projecting neurons (upper left panel). In MORF3 mice, we injected AAV-RFP into the DP (see b1, b2 for injection site) to label its axons, and AAVretro-Cre into the spinal cord. Cre was retrogradely transported to the hypothalamus, triggering the expression of MORF3 and allowing spinal projecting neurons to display finely detailed dendritic morphology (b3). High-resolution 3D lightsheet (b1–4, b7) and confocal (b5–6, b8–12) microscopy images reveal numerous close appositions between DP axonal terminals and the somas and dendrites of MORF3 labeled neurons in the PVHd (b6) and LHA (b7–12) at higher magnifications. Blue arrowheads point to corresponding neurons at different magnifications. White arrowheads highlight close appositions between DP axonal terminals and spinal projecting neurons (see Supplementary Video 1 for multiple putative synaptic connections between the same DP axon and a MORF3 labeled neuron). c,Using a combined AAV1-Cre transsynaptic tagging and Cre-dependent anterograde tracing method, we confirmed that LHA neurons receiving direct DP inputs generate direct projections to the intermediolateral column (IML) of the spinal cord, which houses preganglionic neurons that control sympathetic output. AAV1-Cre was injected into the DP (upper left panel) to anterogradely transport and trans-synaptically spread into postsynaptic LHA neurons, which received an injection of Cre-dependent AAV-FLEX-GFP (lower left panel). This led to the labeling of starter cells generating axonal projections that innervate preganglionic neurons in the IML, as depicted in the microscopic images at thoracic T1 and T2 levels of the spinal cord. The close-up views in the right panels provide a detailed observation of AAV labeled axons, displaying terminal boutons forming close appositions onto IML neurons (c1, c2, c3) and around the center canal (c4). d, Our strategy of uncovering a bi-synaptic pathway through which the DPs regulates vagal parasympathetic output via its projections to the CEA. AAV1-Cre was injected into the DPs (d1). Subsequently, Cre was anterogradely transported to the CEA, which received an injection of Cre-dependent AAV-FLEX-GFP (d2) to visualize axonal projections originating from Cre labeled postsynaptic neurons (d3–5). Close up images illustrate starter cells in the CEA, colabeled with Cre and AAV-GFP (d2). Dense axonal terminals labeled with AAV-GFP were observed in the DMX and NTS (d5), confirming the bi-synaptic pathway DP→CEA→DMX. Additionally, dense axonal labeling was evident in other brain structures involved in autonomic function control, including the bed nucleus of the stria terminalis (BST, d3), substantia innominata (SI, d3), parabrachial nucleus (PB, d4), parvicellular reticular nucleus (PARN), and intermediate reticular nucleus (IRN, d5). The lower right image shows axonal terminals resulting from non-selective CEA neurons in the DMX/NTS as a comparison (d6). All scale bars = 500 μm. e, Schematic illustrating that the DPs, DPd, and ILA form a core cerebral neural network in controlling autonomic outputs (refer to Extended Data Figs. 16–21, 23–24 for additional data). f, Direct projections to Barrington’s nucleus (B) from the ILA (left) and DPd (green) (right panel), indicating bi-synaptic connections of the MPF in controlling lumbosacral parasympathetic outputs (DPd/ILA→Barrington’s nucleus→spinal cord). Scale bars = 500 μm.
Figure 5:
Figure 5:. DPd projections to the hypothalamic neuroendocrine zone.
a, Images show axonal projections originating from the DPd generating dense axonal terminals along the entire hypothalamic periventricular zone, which houses the vast majority of neuroendocrine cells (refer to Extended Data Fig. 25 for additional data). See Table 1 for additional abbreviations of brain structures. All scale bars = 500 μm. b, Quantitative comparison of projections from different MPF areas to the paraventricular hypothalamic nucleus (PVH), which contains both neuroendocrine and pre-autonomic cells, and the periventricular nucleus (PV), primarily composed of neuroendocrine cells. The pareto chart, which orders the number of projections in descending order showed that both the PVH and PV receive the densest input from the DPd (also see Extended Data Fig. 25b-c). The cumulative total of projections is represented by the curved line. Projections from the DPs to the PVH likely target the PVH descending part, which contains preautonomic neurons as shown in Fig. 4a. c, Shows retrogradely labeled neurons in the DPd after FG was injected into the PVH, validating the direct DPd→PVH projections. Refer to Extended Data Fig. 26a for further validation of monosynaptic DPd inputs to PVH CRH neurons using TVA-receptor mediated cell type-specific rabies viral tracing method. d, To further validate specificities of DPd projections to the hypothalamic neuroendocrine zone, in VGLUT2-Cre mice, AAV-FLEX-RFP was injected into the DPd (see Extended Data Fig. 26a for injection site; see Fig. 1d for Vglu2 expression specificities in the DPd). VGLUT2 positive neurons in the DPd produced dense projections that directly innervated hypothalamic neuroendocrine neurons, which are labeled with retrograde tracer fluorogold (FG, through a tail vein injection, middle and right panels). Using RNAscope (left panel), we confirmed the distribution of somatostatin (SS) neuroendocrine neurons in the periventricular nucleus (PVi) and periventricular part of the PVH (PVHpv), as well as corticotropin-releasing hormone (CRH) neurons in the PVHmpd. DP axonal terminals are densely intermingled with those neuroendocrine cells and form close appositions, as depicted in the close up images (right panel) (see Extended Data Fig. 25d for location of different neuroendocrine cells). e, Shows putative DP connections onto PVH CRH neurons. An AAV synaptophysin tagged GFP anterograde tracer was injected into the DP of CRH-Cre/Ai14 mice. High resolution 60x images show terminal from the DP (green) contacting CRH neurons in the PVH (red). These putative synaptic contacts can be clearly seen in the coronal, horizontal, and sagittal views. f, Schematic network model illustrating how the DP, along with the MEA, CEA, and BST, regulates hypothalamic neuroendocrine outputs. They achieve this through direct projections to the hypothalamic periventricular zone or indirectly via projections to various hypothalamic nuclei, such as AVPV, MEPO, MPNm, and DMH (see Extended Data Figs. 25a, 26f, 27a-b). g, Functional validation of monosynaptic innervation of DPd neurons onto CRH PVH neurons. The left panel illustrates the experimental strategy. In CRH-Cre mice, ChR2 was injected into the DP, while Cre-dependent AAV-RFP was injected into the PVH to label CRH positive neuroendocrine cells. This allowed examination of CRH neuron responses to optogenetic stimulation of ChR2 positive axons originating from the DP using slice patch-clamp recordings. The middle panels display ChR2 injection in the DP and CRH positive neurons in the PVH, intermingled with ChR2 positive axons. The boxed region highlights representative biocytinlabeled CRH neurons from the patch-clamp recording experiment. In the lower panels, close up images show co-localization of biocytin (left) and CRH (right) in the same neuron. The box-and-whisker plot on the right depicts the distribution of peak amplitude responses evoked by optogenetic stimulation of DP inputs (12/14 neurons responded), indicating the median, highest, and lowest values. The trace on the right is a representative example of a response from a CRH neuron. Median peak amplitudes of currents evoked by optogenetic stimulation were not significantly different between groups (83±21 pA, n=14). h-i, Experimental design to demonstrate the functional regulation of the HPA axis by DPd in response to inputs from the ventral subiculum (SUBv) and BLAa. h, Following the injection of AAV1-Cre into the SUBv and BLAa, Cre is anterogradely transported and transsynaptically spreads to the postsynaptic DPd neurons, which received an injection of Cre-dependent AAV-FLEX-ChR2. Consequently, only those neurons that receive direct inputs from the SUBv and/or BLAa express ChR2. This ChR2 is then anterogradely transported to the PVH and innervates CRH neurons, which control the HPA axis. Therefore, optogenetic stimulation of DPd neurons should result in elevated plasma corticosterone (CORT) levels. The right panel presents microphotographs showing the fiber tip and the corresponding expression of Cre, ChR2, and c-fos. The lower panel illustrates the PVHmpd containing ChR2 axons originating from the DPd and the increased expression of c-fos in response to optogenetic stimulation. i, Plasma CORT levels are significantly higher in the ChR2 group compared to the control group, which received DP injections of AAV-mCherry. The difference is statistically significant, with p=0.0049 in the unpaired t-test (parametric) and p=0.0048 in the Mann-Whitney test (nonparametric).
Figure 6:
Figure 6:. Functional relevance of DP neurons in integrating different sensory modalities and regulating social behavior
a-c, Convergent inputs from the AUDv and ENTl or AUDv and PIR onto DP neurons. a, c, Left panels showing images of AAV1-Cre injections into the AUDv and AAV-ChR2 into either ENTl (a) or PIR (c). In both cases, Cre-dependent AAV-RFP was injected into the DP to reveal postsynaptic neurons transported from the AUDv, which are intermingled with ChR2 positive axons arising from the ENTl (a) or PIR (c). The close up images show representative biocytin labeled DP neurons from patch-clamp recording experiments. b, Shows patch clamp recording results. The box and whisker plot on top shows the distribution of peak amplitude responses evoked by optogenetic stimulation of ENTl inputs (12/17 neurons responded). The median, highest, and lowest values are indicated. Trace on the right is a representative example of a response from an RFP-tagged neuron in DP. The plot on the bottom shows distribution of peak amplitude responses evoked by optogenetic stimulation of piriform cortex inputs (10/11 neurons responded) and a representative trace example. Median peak amplitudes of currents evoked by optogenetic stimulation were not significantly different between groups (137.4 pA, n=11 from piriform cortex and 218.3 pA, n=12 from entorhinal cortex, p=0.782, Mann-Whitney Rank Sum Test) (see Extended Data Fig. 29a for procedure to isolate monosynaptic responses). d-i, DP and ILA imaging during social behavior. d, Behavioral schematic: miniscope calcium imaging during non-social interactions (open-field and object exploration) and social interactions (same-sex partner and opposite-sex partner) synchronized with behavior camera recording. e, Calcium imaging field of view and example extracted traces (top: DP, bottom: ILA). f-g,Percentage of time miniscoped-animals spent interacting with non-social (object) versus social (same-sex, opposite-sex) targets during the behavioral trials. Interaction time was significantly different across different type of interactions (Left, DP; Right, ILA). One-way ANOVA: DP, F(1.473, 5.154)=13.47, *P=0.0108; ILA, F(1.646, 8.230)=6.883, P=0.0205. Tukey's multiple comparisons test: **P=0.0051. Error bars represent standard errors of the mean. h-i,Percentage of behaviorally responsive cells during interactions with non-social stimuli (object) or social target (same-sex or opposite-sex). j,Percentage of all behaviorally responsive cells (Inhibited+Excited). DP contains significantly more opposite-sex interaction responsive cells than object exploration responsive cells. Tukey's multiple comparisons test: *P=0.0149. Significantly more opposite-sex interaction responsive cells are identified in DP than in ILA. Sidak's multiple comparisons test: **P=0.0027. See Extended Data Fig. 29b-c for additional data. k, Frequency of calcium events during non-social behavior trials (open-field) and social behavior trials (same-sex and opposite-sex). In DP, frequency of calcium event is significantly higher during same-sex interaction compared to that during open-field test (Tukey's multiple comparisons test, *P=0.0303). In ILA, frequencies of calcium event during both same-sex interaction (Tukey's multiple comparisons test, **P=0.0086) and opposite-sex interaction (Tukey's multiple comparisons test, **P=0.0094) are significantly higher than that during open-field test. Between DP and ILA, frequencies of calcium event during open-field test (Sidak's multiple comparisons test: *P=0.0416) and same-sex interaction (Sidak's multiple comparisons test: *P=0.0199) are higher than that in ILA.
Figure 7:
Figure 7:. Proposed working model of the MPF based on network analysis.
a, Schematics showing that the DPs, DPd, and ILA constitute the primary visceral motor cortex, which governs neuroendocrine, sympathetic, and parasympathetic outputs. The right panel depicts the schematic network pathways of the three components of the primary visceral motor cortex within the whole mouse brain. b, Left panel shows the anatomic location of the DPs and DPd in 2D. Middle panels show a schematic and wiring diagram that illustrate the DP as a critical junction node, mediating a predominantly unidirectional flow of information from caudal to rostral and lateral to medial within cortico-cortical pathways. The DP bridges communication between lateral cortical subnetworks with both medial cortical and somatic motor cortical subnetworks. Additionally, it facilitates the transfer of information from the olfactory cortex, amygdala, and hippocampus to the MPF. The right panel shows the anatomical locations of the DP, ILA, and other MPF areas in 3D views. c, A proposed unitary MPF model based on network analysis. The DP serves as an integrative center, receiving comprehensive information from both external and internal environments. It transmits this information to other cortical areas including ILA, PL, ACAv, ACAd, MOs, and MOp. Each of these MPF areas, along with MOp/MOs, carries out specific physiological and motor responses to various stress stimuli and plays a role in regulating different goal-directed behaviors to ensure long-term homeostasis through their projections to different brain structures (see main text for details). For example, the ACAd (and its adjacent MOs-fef) and ACAv send dense projections to the dorsomedial striatum or caudoputamen (CP in rodent) and superior colliculus (SC), which aid in coordinating eye and head movement during navigation ,,, and attention . The ACA and its subcortical targets, such as the SC, are also crucial in animals escaping or prey capturing behavior ,. These downstream effectors send projections to the thalamus, creating a feedback loop that allows for the regulation of MPF activities. This network model aligns well with the classic Perception-Evaluation-Action (PVA) model . Abbreviations: ACB, nucleus accumbens; AHN, anterior hypothalamic nucleus; AI, agranular insular cortex; ARH, arcuate nucleus; AVPV, anteroventral periventricular nucleus; B, Barrington’s nucleus; BSTam, al, rh, the anteromedial, anterolateral, rhomboid nuclei of the bed nuclei of the stria terminalis; BLAa, anterior basolateral amygdalar nucleus; CEA, central amygdalar nucleus; CLA, claustrum; CP, caudoputamen; DMH, dorsomedial hypothalamic nucleus; DMX, dorsal motor nucleus of the vagus nerve; MEPO, median preoptic nucleus; MPN, medial preoptic nucleus; MPO, medial preoptic area; IML, intermediolateral column of the spinal cord; LHA, lateral hypothalamic area; PMd, dorsal premammillary nucleus; PVHd, descending part of the hypothalamic paraventricular nucleus; PVHm & PVHp, magnocellular & parvicellular divisions of the hypothalamic paraventricular nucleus; PVi, intermediate part of the hypothalamic periventricular nucleus; PVZ, hypothalamic periventricular zone; SC, superior colliculus; SO, supraoptic nucleus. See Table 1 for additional abbreviations.

References

    1. McKlveen J. M., Myers B. & Herman J. P. The medial prefrontal cortex: coordinator of autonomic, neuroendocrine and behavioural responses to stress. J Neuroendocrinol 27, 446–456 (2015). 10.1111/jne.12272 - DOI - PMC - PubMed
    1. Hansel A. & von Kanel R. The ventro-medial prefrontal cortex: a major link between the autonomic nervous system, regulation of emotion, and stress reactivity? Biopsychosoc Med 2, 21 (2008). 10.1186/1751-0759-2-21 - DOI - PMC - PubMed
    1. Fuster J. The Prefrontal Cortex. Fifth edn, (Elsevier, 2015).
    1. Ongur D. & Price J. L. The organization of networks within the orbital and medial prefrontal cortex of rats, monkeys and humans. Cereb Cortex 10, 206–219 (2000). 10.1093/cercor/10.3.206 - DOI - PubMed
    1. Etkin A., Buchel C. & Gross J. J. The neural bases of emotion regulation. Nat Rev Neurosci 16, 693–700 (2015). 10.1038/nrn4044 - DOI - PubMed

Methods References:

    1. Veldman M. B. et al. Brainwide Genetic Sparse Cell Labeling to Illuminate the Morphology of Neurons and Glia with Cre-Dependent MORF Mice. Neuron 108, 111–127 e116 (2020). 10.1016/j.neuron.2020.07.019 - DOI - PMC - PubMed
    1. Hintiryan H. et al. Connectivity characterization of the mouse basolateral amygdalar complex. Nat Commun 12, 2859 (2021). 10.1038/s41467-021-22915-5 - DOI - PMC - PubMed
    1. Fenno L. E. et al. Targeting cells with single vectors using multiple-feature Boolean logic. Nat Methods 11, 763–772 (2014). 10.1038/nmeth.2996 - DOI - PMC - PubMed
    1. Wickersham I. R. et al. Monosynaptic restriction of transsynaptic tracing from single, genetically targeted neurons. Neuron 53, 639–647 (2007). 10.1016/j.neuron.2007.01.033 - DOI - PMC - PubMed
    1. Wall N. R., Wickersham I. R., Cetin A., De La Parra M. & Callaway E. M. Monosynaptic circuit tracing in vivo through Cre-dependent targeting and complementation of modified rabies virus. Proc Natl Acad Sci U S A 107, 21848–21853 (2010). 10.1073/pnas.1011756107 - DOI - PMC - PubMed

Publication types

LinkOut - more resources