. 2025 May 9;74(7):195.
doi: 10.1007/s00262-025-04050-y.

Extracellular PKM2 modulates cancer immunity by regulating macrophage polarity

Affiliations

Extracellular PKM2 modulates cancer immunity by regulating macrophage polarity

Guangda Peng et al. Cancer Immunol Immunother. .

Abstract

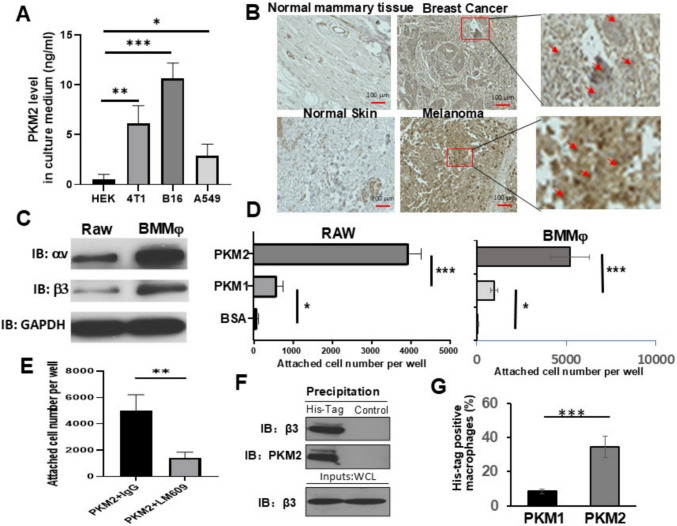
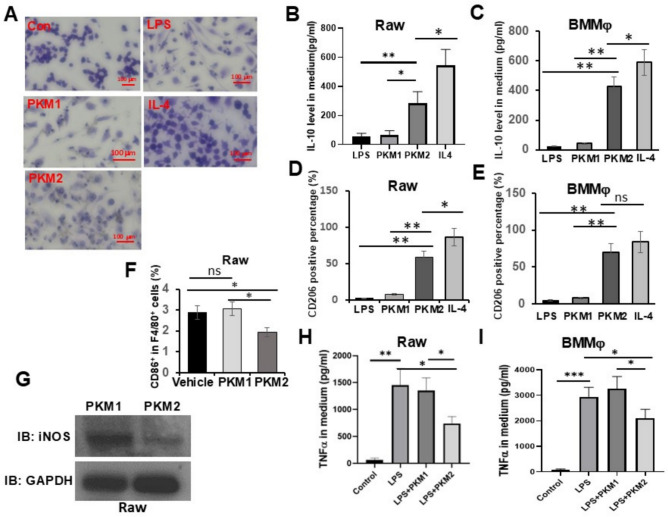
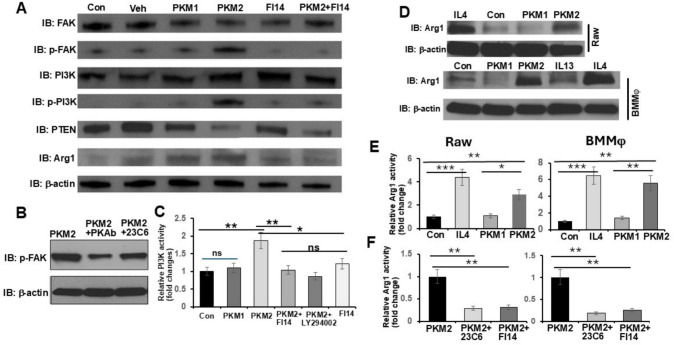
Tumor controls its immunity by educating its microenvironment, including regulating polarity of tumor associated macrophages. It is well documented that cancer cells release PKM2 to facilitate tumor progression. We report here that the extracellular PKM2 (EcPKM2) modulates tumor immunity by facilitating M2 macrophage polarization in tumors. EcPKM2 interacts with integrin αvβ3 on macrophage to activate integrin-FAK-PI3K signal axis. Activation of FAK-PI3K by EcPKM2 suppresses PTEN expression, which subsequently upregulates arginase1 (Arg1) expression and activity in macrophage to facilitate M2 polarity. Our studies uncover a novel and important mechanism for modulation of tumor immunity. More importantly, an antibody against PKM2 that disrupts the interaction between EcPKM2 and integrin αvβ3 is effective in converting M2 macrophages to M1 macrophages in tumors, suggesting a new therapeutic strategy and target for cancer therapies. Combination of the anti-PKM2 antibody with checkpoint blockades provides enhanced treatment effects.

Keywords: Arginase1; Cancer immunotherapy; Glycolysis; Integrin αvβ3; Macrophage; Pyruvate kinase M2.


Conflict of interest statement

Declarations. Conflict interest: The authors declare no competing conflict of interests

Figures

Fig. 1
Fig. 1
Extracellular PKM2 interacts with integrin αvβ3 on macrophages in tumors. A The levels of PKM2 in the culture medium (ng/ml) of indicated cell lines were measured by ELISA. B Representative images of IHC staining of PKM2 in indicated tumor tissues and adjacent normal tissues from patients (n = 12). On the right are images with higher magnification of the call out of red boxes. The red arrows indicate examples of extracellular PKM2. (C) Cellular levels of integrin αv and β3 in Raw and BMMφ cells are measured by immunoblot (IB: αv and IB: β3). IB: GAPDH is a loading control. D Attachment of Raw (left) and BMMφ (right) cells to BSA, PKM1, and PKM2 coated plates, and E attachment of BMMφ cells to PKM2 coated plates in the presence of IgG (as control) or anti-integrin αvβ3 antibody LM609 were measured by cell counting. The cell attachments in (D) and (E) are presented as attached cells per well. F Co-precipitation of His-tagged PKM2 with integrin β3 from cell extracts was measured by His-tag pull-down followed by immunoblot of indicated antibodies (IB: β3 or IB: PKM2). Control is the His-tag pull-down from cell extracts without addition of bait His-tag PKM2 to the extracts. IB: β3 in the input of whole cell lysate (Inpust:WCL) represents the total extracts used for His-tag pull-down. G Binding of His-tagged PKM2 or PKM1 to macrophage in 4T1 tumors was analyzed by FACS using anti-His-tag antibody (n = 6). Macrophages were first sorted by FACS using CD45+/F4/80+. The resultant population was FACS analyzed by His-tag+ sorting and is presented as % of His-tag positive cells in the total population of CD45+/F4/80+. Error bars in A, D, and E, represent mean ± S.E.M. from 5 independent experiments, and in (G) is standard deviations of calculation of 6 mice. *P < 0.05, **P < 0.01, ***P < 0.001
Fig. 2
Fig. 2
EcPKM2 promotes M2 macrophage polarity. A Representative phase contrast microscopy images of RAW cells treated by the indicated agents (scale bar 100 μm). B and C Levels of IL-10 in culture medium of RAW (B) and BMMφ (C) cells that were treated with the indicated agents were measured by ELISA. The IL-10 levels are presented as pg/ml culture medium. D, E CD206+ Raw (D) or BMMφ (E) cells that were treated with the indicated agents were analyzed by FACS. Results are presented as % of CD206 positive in total cell population. F FACS analyses of F4/80+ and CD86+ M1 macrophages. G Levels of iNOS (IB: iNOS) in Raw cells were analyzed by immunoblot. The cells were treated with PKM1 or PKM2. H, I Levels of TNFα in culture medium of RAW (H) and BMMφ (I) cells that were treated with the indicated agents were measured by ELISA. The TNFα levels are presented as pg/ml culture medium. Error bars in B, C, D, E, F, H, and I represent mean ± S.E.M. from 5 independent experiments. *P < 0.05, **P < 0.01, ***P < 0.001
Fig. 3
Fig. 3
Effects of extracellular PKM2 on tumor immunity. A The scheme illustrates G415R or PKM1 (blue arrows) treatment regimen of 4T1 mice. B–D Tumor growth curve (B), representative pictures (C), and weight D of 4T1 tumors from mice treated with indicated agents (n = 6). Tumor weights were measured by weighting tumors cut out from the treated mice. E Representative FACS plots of iNOS+ and CD206+ populations in 4T1 tumors treated by indicated agents. The cells collected from tumor were first sorted with CD45+ and F4/80+ FACS gating. F, G FACS analyses of; CD206+ M2 macrophages (F, Upper), iNOS+ M1 macrophages (F, Bottom), CD4+ and FoxP3+ Treg cells (G, Upper), CD8+ cytotoxic T-cells (G, Bottom) in 4T1 tumors from mice treated with indicated agents. in FACS analyses, for macrophage, gated by CD45+ and F4/80+, for T-cells gated by CD3+. H Representative images of whole lungs of treated 4T1 mice treated with indicated agents (n = 10). I Quantitative measurements of both number (Upper) and size (Bottom) of lung metastatic nodules in lung of the treated mice treated with indicated agents (n = 10). J, K FACS analyses of F4/80+ and CD206+ M2 macrophages (J) and CD4+ and FoxP3+ Treg cells (K) in lung metastatic tumors from 4T1 mice treated with indicated agents. L Tumor weight of 4T1 tumors from mice treated with indicated agents (n = 6) was measured by weighting tumors cut out from the treated mice. M Representative images of lungs sections of treated 4T1 mice treated with indicated agents (n = 10). N Quantitative measurements of the number (#) of lung metastatic nodules in lung of the treated mice treated with indicated agents. O–R FACS analyses of F4/80+ and CD206+ M2 macrophages (O, Q) and CD4+ and FoxP3+ Treg cells (P, R) in tumors (O, P) or lung metastatic tumor (Q, R) from 4T1 mice treated with indicated agents. Quantities of M1/M2 macrophages (F, J, O, Q) or Treg/CD8-T cells (G, K, P, R) are presented as fold changes of percentage of total population of macrophages or T cells respectively. Scale Bar in (H) 300 mm, M 100 mm. Error bars in B, F, G, J, K, O, P, Q, and R represent mean ± S.E.M. from 5 independent experiments, and in I and N represent mean ± S.E.M. from 10 mice. *P < 0.05, **P < 0.01
Fig. 4
Fig. 4
Effects of extracellular PKM2 and anti-PKM2 antibody PKAb on tumor immunity. (A) The scheme illustrates G415R or PKM1 (blue arrows) treatment regimen of B16 (Upper) and GEM-NSCLC (Bottom) mice. B, J Tumor weight of B16 tumor bearing mice treated with indicated agents (n = 6) was measured with weighting of sliced tumors from the treated mice. C Quantitative measurements of both number (Upper) and size (Bottom) of lung metastatic nodules in lung of the B16 mice treated with indicated agents (n = 10). D, E, F and G FACS analyses of F4/80+ and CD206+ M2 macrophages (D, F) and CD4+ and FoxP3+ Treg cells (E, G) in B16 tumors D, E and GEM-NSCLC tumors F, G from mice treated with indicated agents. H and I FACS analyses of F4/80+ and CD206+ M2 macrophages (H) and CD4+ and FoxP3+ Treg cells (I) in lung metastatic tumors from B16 mice treated with indicated agents. Quantities of M2 macrophage (D, F, H) or Treg cell (E, G, I) are presented as fold changes of percentage of macrophages or Treg in total population of macrophages or T cells respectively. K and L, M, and N FACS analyses of F4/80+ and CD206+ M2 macrophages (K, M) and CD4+ and FoxP3+ Treg cells (L, N) in B16 tumors K, L and GEM-NSCLC tumors M, N from mice treated with indicated agents. O, P FACS analyses of CD4+ and FoxP3+ Treg cells (O) and F4/80+ and CD206+ M2 macrophages (P) in lung metastatic tumors from B16 mice treated with indicated agents. Quantities of M2 macrophage (K, M, O) or Treg cell (L, N, P) are presented as fold changes of percentage of macrophages or Treg in total population of macrophages or T cells respectively. Error bars in DP represent mean ± S.E.M. from five independent experiments, and in C represent mean ± S.E.M. from 10 mice. ns: statistically non-significant, *P < 0.05, **P < 0.01
Fig. 5
Fig. 5
EcPKM2 activates FAK-PI3K signal axis and subsequently Arg1 in macrophage. A, B Levels of FAK (IB: FAK), phosphor FAK (IB: p-FAK), PI3K (IB: PI3K), phosphor PI3K (IB: p-PI3K, PTEN (IB: PTEN), and Arg1 (IB: Arg1) in Raw cells were analyzed by immunoblot. The Raw cells were treated with the indicated agents. Con and Veh are control (without treatment) or treated with vehicle respectively. C PI3K activity in Raw cells was measured with PI3K activity kit. The cells were treated with indicated agents. The PI3K activity is presented as relative PI3K activity (fold changes) by defining the activity of untreated control cells (con) as 1. D Levels of Arg1 (IB: Arg1) in Raw (upper) and BMMφ (Bottom) cells were analyzed by immunoblot. The cells were treated with the indicated agents. E, F Arg1 activity in Raw (E, F, Left panel) and BMMφ (E, F, Right panel) cells was measured with Arg1 activity kit. The cells were treated with indicated agents. The Arg1 activity is presented as relative Arg1 activity (fold changes) by defining the activity of untreated control cells (con) as 1 (E) or the PKM2 treated cells as 1 (F). IB: β-actin is a loading control in (A), (B), and (D). Error bars in (C), (E), and (F) represent mean ± S.E.M. from five independent experiments. ns: statistically non-significant, *P < 0.05, **P < 0.01, ***P < 0.001
Fig. 6
Fig. 6
EcPKM2 regulates Arg1 levels and activity by suppressing PTEN in macrophage. A Levels of integrin β3 (IB: β3) and Arg1 (IB: Arg1) in Raw cells were analyzed by immunoblot. B Arg1 activity in Raw cells were analyzed using Arg1 activity kit. Integrin β3 in Raw cells was knocked down by β3 siRNA or the cells were treated with scrambled siRNA. The Raw cells were treated with PKM2. The Arg1 activity is presented as relative activity (fold change) by defining the activity of PKM2 and scrambled siRNA treated cells as 1. C Levels of PTEN (IB: PTEN) in Raw (Left) and BMMφ (Right) cells were analyzed by immunoblot. The cells were treated with either PKM1 or PKM2. D Levels of PTEN (IB: PTEN) in Raw cells were analyzed by immunoblot. PTEN was exogenously expressed using PTEN expressing adenoviral vector (AdV-PTEN) or the cells were infected with virus carry empty vector (AdV-Null). E Levels of Arg1 (IB: Arg1) in Raw cells were analyzed by immunoblot. PTEN was exogenously expressed using PTEN expressing adenoviral vector (AdV-PTEN) or the cells were infected with virus carry empty vector (AdV-Null). The cells were treated with vehicle, PKM1 or PKM2. F Arg1 activity in Raw cells were analyzed using Arg1 activity kit. PTEN was exogenously expressed using PTEN expressing adenoviral vector (AdV-PTEN) or the cells were infected with virus carry empty vector (AdV-Null). The cells were treated with PKM2. The Arg1 activity is presented as relative activity (fold change) by defining the activity in AdV-Null/PKM2 cells as 1. G Kaplan-Meier survival analysis of B16 tumor bearing mice treated with indicated agents. Treatment started 8 days after B16 cell inoculation. The n is group size. H Cartoon schematically illustrates the functional role of extracellular PKM2 in modulation of macrophage polarity. Error bars in (B) and (F) represent mean ± S.E.M. from five independent experiments. *P < 0.05, **P < 0.01.

References

    1. Hiam-Galvez KJ, Allen BM, Spitzer MH (2021) Systemic immunity in cancer. Nat Rev Cancer 21(6):345–359 - PMC - PubMed
    1. Gonzalez H, Hagerling C, Werb Z (2018) Roles of the immune system in cancer: from tumor initiation to metastatic progression. Genes Dev 32(19–20):1267–1284 - PMC - PubMed
    1. Binnewies M et al (2018) Understanding the tumor immune microenvironment (TIME) for effective therapy. Nat Med 24(5):541–550 - PMC - PubMed
    1. Mantovani A et al (2022) Macrophages as tools and targets in cancer therapy. Nat Rev Drug Discov 21(11):799–820 - PMC - PubMed
    1. Noy R, Pollard JW (2014) Tumor-associated macrophages: from mechanisms to therapy. Immunity 41(1):49–61 - PMC - PubMed

MeSH terms