

Binary classification of gynecological cancers based on ATR-FTIR spectroscopy and machine learning using urine samples
- PMID: 40343586
- PMCID: PMC12064457
- DOI: 10.1007/s10238-025-01684-1
Binary classification of gynecological cancers based on ATR-FTIR spectroscopy and machine learning using urine samples
Abstract
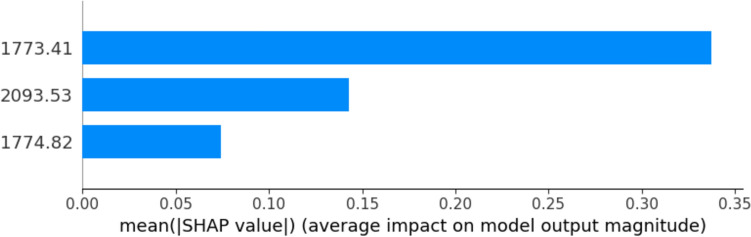
Making an early diagnosis of cancer still in the early stages, when completely asymptomatic, is the challenge modern medicine has been setting for several decades. In gynecology, no effective screening has yet been found and approved for endometrial and ovarian cancer. Mammography is an effective screening method for Breast Cancer, as well as Pap Test for Cervical Cancer, but they are underused in third world countries because of their expensive and specific instrumentation. Previous studies showed how "machine learning analysis methods" of the spectral information obtained from dried urine samples could provide good accuracy in differentiation between healthy and ovarian or endometrial cancer. In this study, we also apply ATR-FTIR spectrometry's practical, fast, and relatively inexpensive principles to liquid urine analysis from 309 patients undergoing surgical treatment for benign or malignant diseases (endometrium, breast, cervix, vulvar and ovarian cancer). The data obtained from those liquid samples were then analyzed to train a machine learning model to classify healthy VS cancer patients. We obtained an accuracy of > 91%, and we also identified discriminant wavelengths (2093, 1774 cm-1). These frequencies are close to already reported ones in other studies, indicating a possible association with tumor presence and/or progression.
Keywords: ATR-FTIR spectroscopy; Gynecological cancers; Machine learning; Urine biomarkers.
© 2025. The Author(s).
Conflict of interest statement
Declarations. Conflict of interest: The authors declare no competing interests. Ethical approval: This study was approved by the Ethical Committee of the University Hospital of Basel (Approval Number: ID 2022-00109). All procedures performed were in accordance with the ethical standards of the institutional and national research committee and with the 1964 Helsinki Declaration and its later amendments or comparable ethical standards. Consent to participate: Informed consent was obtained from all individual participants included in the study. Consent to publish: Not applicable.
Figures


References
-
- Cancer Research UK. Office for National Statistics: Cancer survival by stage at diagnosis for England. 2019.
MeSH terms
Grants and funding
LinkOut - more resources
Full Text Sources
Research Materials
Miscellaneous
