. 2025 May 26;65(10):4783-4796.
doi: 10.1021/acs.jcim.5c00107. Epub 2025 May 9.

Integrating Pharmacokinetics and Quantitative Systems Pharmacology Approaches in Generative Drug Design

Affiliations

Integrating Pharmacokinetics and Quantitative Systems Pharmacology Approaches in Generative Drug Design

Helle W van den Maagdenberg et al. J Chem Inf Model. .

Abstract

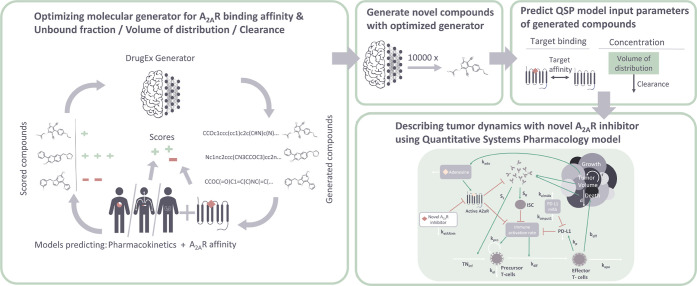
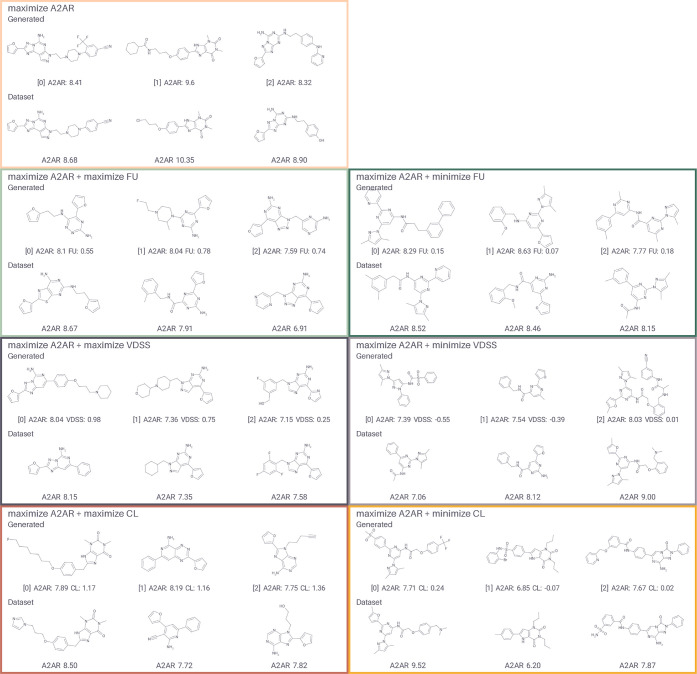
Integrated understanding of pharmacokinetics (PK) and pharmacodynamics (PD) is a key aspect of successful drug discovery. Yet in generative computational drug design, the focus often lies on optimizing potency. Here we integrate PK property predictions in DrugEx, a generative drug design framework and we explore the generated compounds' PD through simulations with a quantitative systems pharmacology (QSP) model. Quantitative structure-property relationship models were developed to predict molecule PK (clearance, volume of distribution and unbound fraction) and affinity for the Adenosine A2AR receptor (A2AR), a drug target in immuno-oncology. These models were used to score compounds in a reinforcement learning framework to generate molecules with a specific PK profile and high affinity for the A2AR. We predicted the expected tumor growth inhibition profiles using the QSP model for selected candidate molecules with varying PK and affinity profiles. We show that optimizing affinity to the A2AR, while minimizing or maximizing a PK property, shifts the type of molecular scaffolds that are generated. The difference in physicochemical properties of the compounds with different predicted PK parameters was found to correspond with the differences observed in the PK data set. We demonstrated the use of the QSP model by simulating the effect of a broad range of compound properties on the predicted tumor volume. In conclusion, our proposed integrated workflow incorporating affinity predictions with PKPD may provide a template for the next generation of advanced generative computational drug design.


Figures

1
1
Overview of the workflow for de novo drug design described in this paper. First, a DrugEx molecular generator is trained to generate compounds with activity for the A2AR and a specified pharmacokinetic profile through reinforcement learning. It is trained to either maximize or minimize a specified pharmacokinetic property (CL, VDSS or FU). Then, the trained models are used to generate 10,000 compounds each. Finally, QSPR models are used to predict A2AR target affinity, VDSS and CL of the novel compounds, which form the input for a QSP model (adapted from ref ). This model dynamically simulates the drug effect on the tumor microenvironment.
2
2
Scatter plots of observed (x-axis) versus predicted (y-axis) values showing the performance of best QSPR models for (A) A2AR binding affinity, (B) CL, (C) FU, and (D) VDSS on the 5-fold cross-validation validation sets (light gray) and the independent test set (green). Performance metrics R2 and RMSE are noted in the corresponding figures. Mean R 2 and RMSE values are used for the cross-validation test sets.
3
3
Bootstrapping performance of the QSPR models for 50 random splits and 50 cluster splits for the outliers (peach), the inliers (light green), and the complete test set (dark green), respectively. Each row shows a different metric, R 2 and RMSE (calculated on transformed target properties) and the fraction of samples in the test set. The columns show the performance of the different target properties: A2AR binding affinity, FU, VDSS and CL.
4
4
Distribution of scores of all valid and unique molecules from a set of 10,000 generated molecules for different DrugEx optimization scenarios. The panels show optimization for (A) maximization of A2AR pKi, (B) A2AR pKi + minimization/maximization of FU, (C) A2AR pKi + maximization/minimization of VDSS and (D) A2AR pKi + maximization/minimization of CL. The left column in each panel shows the A2AR pKi density and the right column shows the respective PK property density.
5
5
Umap representation of the A2AR data set overlapping with the density of the generated molecules from the trained DrugEx generators with different objectives. The columns represent the different combinations of properties. The first row shows the data set colored by the different properties from left to right: A2AR pKi (data set), sqrt FU, log VDSS, log CL (predicted); containing only the molecules applicable for that combination of objectives. The second row shows the density of all valid and unique molecules generated by the fine-tuned models. The third and fourth rows show the density of the unique and valid generated molecules for maximization of the A2AR pKi and maximization or minimization of a PK property, respectively. Square frames with numbers indicate the location of the molecules highlighted in Figure .
6
6
Example generated molecules and most similar data set compounds for different DrugEx optimization scenarios. Each box contains the centroids of the five largest clusters from leader picker cluster analysis (Tanimoto similarity threshold 0.8, Morgan fingerprints with radius 3, bits 2048) on the set of generated molecules. The first row shows the centroids, and the second row shows the most similar data set compounds by Tanimoto distance (Morgan fingerprints with radius 3, bits 2048.). Below each generated compound the predicted value for each relevant property is shown; below each data set compound the experimental mean A2AR pKi is shown.
7
7
Box plots of the physicochemical properties (Wildman-Crippen LogP, Molecular Weight, Topological Polar Surface Area, Fraction of sp3-hybridized carbons) of all valid and unique molecules from a set of 10,000 generated molecules for different DrugEx optimization scenarios.
8
8
Simulated effect of de novo generated compounds on tumor volume in mice using a quantitative systems pharmacology (QSP) model. (A) A simplified graphical representation of the QSP model (figure and model adapted from Voronova et al.), describing the relationship between the predicted concentration–time curve of the novel A2AR inhibitors and its inhibition of the immunosuppressive effect. White arrows indicate the dynamics of system components, such as the influx of precursor T-cells (TNinf) or tumor cell death (d). Red and green arrows indicate inhibition or stimulation of a model effect, respectively. (B) Simulations of four example generated compounds with extreme potency and elimination rate showing the tumor volume over time with the dosing interval between 8 and 23 days (dashed lines) (C) Line plots show the predicted tumor volume over time for all valid, unique, and within-applicability domain molecules from a set of 10,000 generated molecules. The colored shaded areas are the 90% prediction intervals, and the solid line is the mean prediction. The light gray shaded area and dashed lines represent the baseline scenario.

Similar articles

References

    1. Dowden H., Munro J.. Trends in clinical success rates and therapeutic focus. Nat. Rev. Drug Discovery. 2019;18:495–496. doi: 10.1038/d41573-019-00074-z. - DOI - PubMed
    1. Lucas A. J., Sproston J. L., Barton P., Riley R. J.. Estimating human ADME properties, pharmacokinetic parameters and likely clinical dose in drug discovery. Exp. Opin. Drug Discovery. 2019;14:1313–1327. doi: 10.1080/17460441.2019.1660642. - DOI - PubMed
    1. Chen E. P., Bondi R. W., Michalski P. J.. Model-based Target Pharmacology Assessment (mTPA): An Approach Using PBPK/PD Modeling and Machine Learning to Design Medicinal Chemistry and DMPK Strategies in Early Drug Discovery. J. Med. Chem. 2021;64:3185–3196. doi: 10.1021/acs.jmedchem.0c02033. - DOI - PubMed
    1. Reymond J.-L., Awale M.. Exploring Chemical Space for Drug Discovery Using the Chemical Universe Database. ACS Chem. Neurosci. 2012;3:649–657. doi: 10.1021/cn3000422. - DOI - PMC - PubMed
    1. Gómez-Bombarelli R., Wei J. N., Duvenaud D., Hernández-Lobato J. M., Sánchez-Lengeling B., Sheberla D., Aguilera-Iparraguirre J., Hirzel T. D., Adams R. P., Aspuru-Guzik A.. Automatic Chemical Design Using a Data-Driven Continuous Representation of Molecules. ACS Cent. Sci. 2018;4:268–276. doi: 10.1021/acscentsci.7b00572. - DOI - PMC - PubMed

Substances

LinkOut - more resources