. 2025 May 27;44(5):115687.
doi: 10.1016/j.celrep.2025.115687. Epub 2025 May 8.

A retinoic acid:YAP1 signaling axis controls atrial lineage commitment

Affiliations

A retinoic acid:YAP1 signaling axis controls atrial lineage commitment

Elizabeth Abraham et al. Cell Rep. .

Abstract

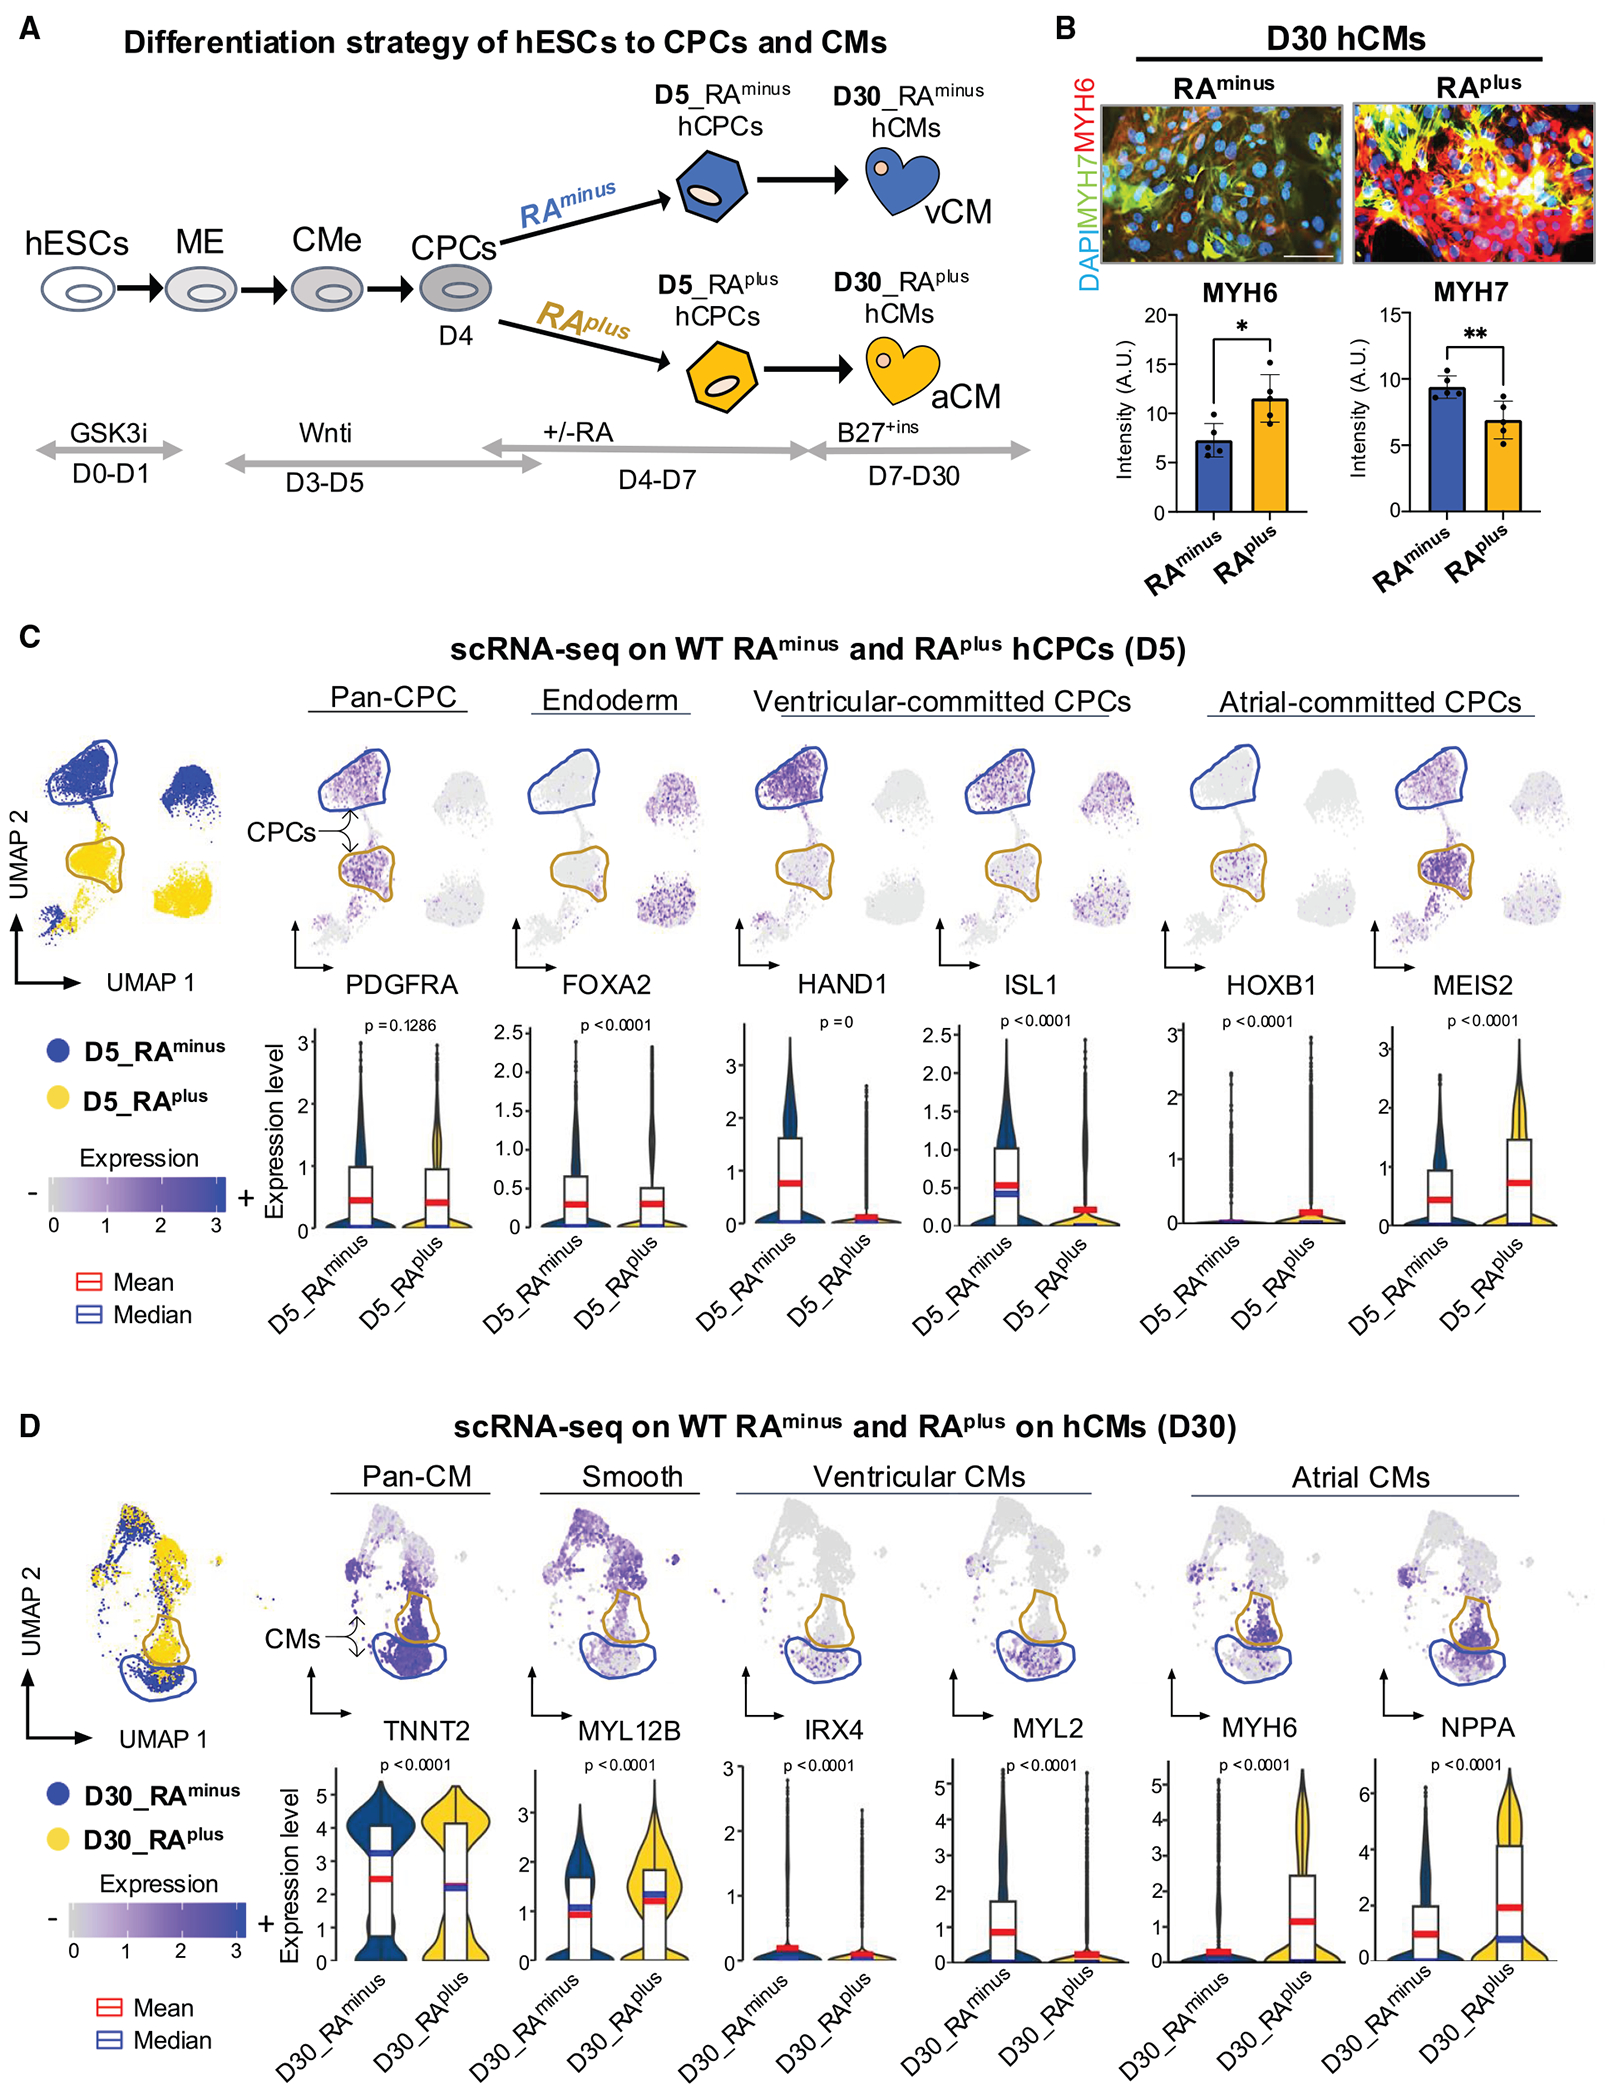
In cardiac progenitor cells (CPCs), retinoic acid (RA) signaling induces atrial lineage gene expression and acquisition of an atrial cell fate. To achieve this, RA coordinates a complex regulatory network of downstream effectors that is not fully identified. To address this gap, we applied a functional genomics approach (i.e., scRNA-seq and snATAC-seq) to untreated and RA-treated human embryonic stem cell (hESC)-derived CPCs. Unbiased analysis revealed that the Hippo effectors YAP1 and TEAD4 are integrated with the atrial transcription factor enhancer network and that YAP1 activates RA enhancers in CPCs. Furthermore, Yap1 deletion in mouse embryos compromises the expression of RA-induced genes, such as Nr2f2, in the CPCs of the second heart field. Accordingly, in hESC-derived patterned heart organoids, YAP1 regulates the formation of an atrial chamber but is dispensable for the formation of a ventricle. Overall, our findings revealed that YAP1 cooperates with RA signaling to induce atrial lineages during cardiogenesis.

Keywords: CP: Developmental biology; NR2F2; SHF; TEAD4; YAP1; atrial differentiation; cardiac enhancers; cardiac progenitors; chamber development; heart organoids; retinoic acid signaling.


Conflict of interest statement

Declaration of interests The authors declare no competing interests.

Figures

Figure 1.
Figure 1.. scRNA-seq analysis of RAminus and RAplus hCPCs and hCMs captures the expression of atrial and ventricular lineage genes
(A) Scheme depicting the strategy for cardiac induction in hESCs. (B) Immunostaining and quantification of the atrial and ventricular markers MYH7 and MYH6 in D30 CMs treated as indicated (n = 5). Scale bar, 100 μm. Data are presented as mean ± SEM. Statistical analysis: Students t test, *p < 0.05, **p < 0.01. (C) scRNA-seq was performed on D5 RAminus and RAplus samples (1 μM RA, 24 h). UMAP and violin plots display the indicated markers. Cells are colored by annotation (yellow and blue) or by expression of marker genes. Mean and median of gene expression is shown as well. Statistical analysis: Wilcoxon rank-sum test, p values are listed within the graphs. (D) Similar to (C), scRNA-seq was performed on D30 in RAminus and RAplus samples (1 μM RA, 72 h from D4 to D7). UMAP and violin plots show markers of typical atrial and ventricular CMs. Two independent experiments were performed for immunostaining and for differentiation. hESCs, human embryonic stem cells; ME, mesoendodermal; CMe, cardiac mesoderm; CPC, cardiac progenitor cells; RA, retinoic acid; v, ventricular; a, atrial; CM, cardiomyocyte; GSK3i, GSK3 inhibitor; Wnti, Wnt inhibitor; UMAP, uniform manifold approximation and projection.
Figure 2.
Figure 2.. RA treatment in hCPCs triggers genome-wide opening of TEAD4 enhancers
(A) snATAC-seq experiments were performed on RAminus and RAplus D5 cultures. Scheme shows chromatin accessibility changes and the number of genes induced by RA treatment in hCPCs. (B) Heatmap of RA-target genes displaying changes in chromatin accessibility (snATAC-seq) and gene expression (snRNA-seq) in the hCPCs. (C) De novo motifs analysis showing the top motifs lost and gained in RAplus versus RAminus hCPCs. (D) Pie chart showing the number of RA-induced differentially activated regions (DARs) with and without TEAD4 motifs. (E) Gene ontology (GO) analysis of genes near RA-induced TEAD4 enhancers. Pathways with false discovery rate (FDR < 0.05) were considered significantly enriched. (F) Bars graph shows the top DNA motifs found in TEAD4 enhancers. The p value indicates the motifs significantly associated with TEAD4. Statistical test: chi-squared test. (G) Genome browser captures show TEAD4 binding (ChIP-seq) on RA-DARs containing TEAD4 motifs. Inputs are shown as controls. (H) Scheme summarizing results. Two independent ChIPs and differentiation experiments were pooled for snATAC-seq and ChIP-seq analysis.
Figure 3.
Figure 3.. RA induces YAP1 binding to TEAD4 enhancers in hCPCs
(A) ChIP-seq of YAP1 and TEAD4 were performed in RAminus and RAplus hCPCs. Histograms show average signal intensity across all regions, and heatmaps indicate signal intensity across multiple genomic regions. (B) Volcano plot showing YAP1 bound peaks (ChIP-seq) on RA-regulated enhancers (snATAC-seq). The number of YAP1 peaks on RA enhancers containing TEAD4 motifs is indicated. (C) IGV browser snapshots show YAP1 and TEAD4 binding on RA-DARs containing TEAD4 motifs on the indicated genes. Other motifs found in the RA-DARs are highlighted in the colored boxes (T = TEAD4, G = GATA3, N = NR2F2, F = FOXP1, and M = MEIS1). Inputs are shown as controls. (D) ChIP-qPCR analysis of indicated proteins. The amplified gene regions are depicted on the IGV browser snapshot (C). Data are presented as mean ± SEM. Statistical analysis: Student’s t test, *p < 0.05, **p < 0.01, ***p < 0.001. NegC, negative control region. (E) AlphaFold3 prediction of YAP1 (yellow), TEAD4 dimer (blue), GATA3 (green), and NR2F2 (pink) binding to the NPPB promoter region. Three independent differentiation replicates and ChIP experiments were pooled for sequencing and ChIP-qPCR analysis.
Figure 4.
Figure 4.. YAP1 regulates lineage genes in RAplus hCPCs
(A) snATAC-seq analyses were performed in RA-treated YAP1 KO hCPCs and compared with WT. Scheme depicts the number of chromatin regions with altered accessibility in the absence of YAP1. (B) Heatmap shows the chromatin accessibility (peak intensity) of RA-induced TEAD4 enhancers in WT and YAP1 KO RAplus hCPCs. (C) Top motifs that lost accessibility in the RA-treated YAP1 KO hCPCs compared with WT. (D) UMAP distribution of WT and YAP1 KO RAplus cultures, colored by sample identity. The two main populations identified corresponding to endoderm (FOXA2+) and CPCs (PDGFRA+) are highlighted. (E) Heatmap shows the differentially expressed genes in the YAP1 KO CPCs versus WT from scRNA-seq analysis (Log2FC > [0.5], adj p < 0.01). (F) WB shows HAND1 expression in indicated samples. Actin was used as loading control. Three biological independent replicates are shown. (G) GO analysis of DEGs in the YAP1 KO versus WT RAplus hCPCs. Heart development-related categories are highlighted (−Log10 [adj. p value] > 1.3).
Figure 5.
Figure 5.. YAP1 loss compromises atrial chamber development in human ESC-derived patterned heart organoids
(A) Scheme outlines the cardiac induction protocol. The D30 mature organoids develop a patterned (A) atrial, (V) ventricular, and (PE) proepicardium structures, as indicated in the scheme. (B) Representative bright-field images of WT and YAP1 KO H1 hESCs differentiated to heart organoids as shown in (A) taken at the indicated days. Scale bars, 200 μm. (C) Graph shows RT-qPCR analysis of atrial and ventricular markers at the indicated differentiation days during heart organoids formation. Gene expression levels were normalized to HPRT1. Each dot represents an organoid, at least 10 organoids per genotype were analyzed. Data are represented as mean ± SEM. Statistical analysis: Student’s t test, p values are listed on the graph *p < 0.05, **p < 0.01, ***p < 0.001, ****p < 0.0001. (D) Same as (C). Graphs show RT-qPCR analysis of the pan-CM marker TNNT2. (E) Immunofluorescence images of representative WT and YAP1 KO day 30 organoids stained with DAPI (blue), the ventricular marker MYL3 (red), and the atrial marker NR2F2 (green). Scale bar, 200 μm. Three organoids are shown. (F) Quantification of NR2F2+ and MYL3+ areas and organoid cross-section area, normalized to DAPI area (n = 7–8). Data are represented as mean ± SEM. Statistical analysis: Student’s t test, *p < 0.05, **p < 0.01, ***p < 0.001, ****p < 0.0001.
Figure 6.
Figure 6.. Conditional Yap1 deletion in vivo alters the transcriptome of CPC populations
(A) Simplified scheme of an E7.75 embryo. E7.75 Yap1 cKO (Sox2cre:Yap1 flox/flox) and heterozygous control (Sox2cre:Yap1 flox/+) embryos were processed for scRNA-seq analysis. (B) Unbiased clustering identified 19 clusters in these embryos, annotated as indicated in (E) using known markers (see also Figure S6F). (C) UMAP plot shows Yap1 expression levels in indicated samples. Red arrowhead marks the extraembryonic (ExE) (Sox2 Rhox5+; it does not express the cre). (D) UMAP plot of normalized number of cells in control and Yap1 cKO embryos. (E) Dot plot graph shows the number of DEGs in Yap1 cKO embryos compared with the control embryos in each cluster. Note that the bigger the dot, the more DEGs in the given population (abs(Log2FC) > 0.25, adj p < 0.05). (F) Heatmap shows DEGs in the SHF of Yap1 cKO embryos versus control embryos. Genes relevant for heart development are highlighted. Genes in red are involved in SHF patterning and RA activity. UMAP plots show the expression levels of indicated genes. (G) Violin plots show expression levels of indicated genes in each cluster, in controls and Yap1 cKO embryos. Dotted box highlights the SHF cluster. Adjusted p value, based on Bonferroni correction is below 0.05. *p < 0.05, **p < 0.001, ***p < 0.0001. (H) Western blot (WB) analysis of E7.75 control and Yap1 cKO embryos. Analyzed proteins are indicated. GAPDH was used as loading control. Number of embryos loaded per lane is shown on top. (I) Graphs show RT-qPCR analysis of relevant DEGs identified in the scRNA-seq analysis. The analyzed genes are indicated. (n = 3) Data are represented as mean ± SEM. Statistical analysis: Student’s t test. *p < 0.05, **p < 0.01, ***p < 0.001. (J) WB of E8.25 control and Yap1 cKO embryos blotted against the indicated proteins. GAPDH was used as loading control. The number of embryos loaded per lane is indicated.
Figure 7.
Figure 7.. Conditional Yap1 deletion alters the activity of vitamin A/RA signaling pathway
(A) Single-cell pathway enrichment analysis (SCPA) was applied to DEGs of Yap1 cKO versus control embryos. UMAP plot highlights enrichment of a “Reactome signaling by RA” term. Significant q values (>1.4) are displayed in orange. The name of the populations with significant changes are shown. (B) Same as (A), but highlighting enrichment of “PID_retinoic acid pathway” term. (C) UMAP plots show distribution and levels of the indicated genes in Yap1 cKO and control embryos. (D) Violin plots show expression levels of indicated genes. Dotted box highlights the SHF cluster. Adjusted p value, based on Bonferroni correction is below 0.05. *p < 0.05, **p < 0.001, ***p < 0.0001. (E) Scheme summarizing conclusions from this figure and Figure 6.

Update of

References

    1. Duester G. (2008). Retinoic acid synthesis and signaling during early organogenesis. Cell 134, 921–931. 10.1016/j.cell.2008.09.002. - DOI - PMC - PubMed
    1. Li P, Pashmforoush M, and Sucov HM (2010). Retinoic acid regulates differentiation of the secondary heart field and TGFbeta-mediated outflow tract septation. Dev. Cell 18, 480–485. 10.1016/j.devcel.2009.12.019. - DOI - PMC - PubMed
    1. Ryckebusch L, Wang Z, Bertrand N, Lin SC, Chi X, Schwartz R, Zaffran S, and Niederreither K (2008). Retinoic acid deficiency alters second heart field formation. Proc. Natl. Acad. Sci. USA 105, 2913–2918. 10.1073/pnas.0712344105. - DOI - PMC - PubMed
    1. Sirbu IO, Zhao X, and Duester G (2008). Retinoic acid controls heart anteroposterior patterning by down-regulating Isl1 through the Fgf8 pathway. Dev. Dyn 237, 1627–1635. 10.1002/dvdy.21570. - DOI - PMC - PubMed
    1. Bertrand N, Roux M, Ryckebüsch L, Niederreither K, Dollé P, Moon A, Capecchi M, and Zaffran S (2011). Hox genes define distinct progenitor sub-domains within the second heart field. Dev. Biol 353, 266–274. 10.1016/j.ydbio.2011.02.029. - DOI - PMC - PubMed

MeSH terms

LinkOut - more resources