. 2025 May 9;135(12):e191315.
doi: 10.1172/JCI191315. eCollection 2025 Jun 16.

SARM1 loss protects retinal ganglion cells in a mouse model of autosomal dominant optic atrophy

Affiliations

SARM1 loss protects retinal ganglion cells in a mouse model of autosomal dominant optic atrophy

Chen Ding et al. J Clin Invest. .

Abstract

Autosomal dominant optic atrophy (ADOA), the most prevalent hereditary optic neuropathy, leads to retinal ganglion cell (RGC) degeneration and vision loss. ADOA is primarily caused by mutations in the optic atrophy type 1 (OPA1) gene, which encodes a conserved GTPase important for mitochondrial inner membrane dynamics. To date, the disease mechanism remains unclear, and no therapies are available. We generated a mouse model carrying the pathogenic Opa1R290Q/+ allele that recapitulated key features of human ADOA, including mitochondrial defects, age-related RGC loss, optic nerve degeneration, and reduced RGC functions. We identified sterile alpha and TIR motif containing 1 (SARM1), a neurodegeneration switch, as a key driver of RGC degeneration in these mice. Sarm1 KO nearly completely suppressed all the degeneration phenotypes without reversing mitochondrial fragmentation. Additionally, we show that a portion of SARM1 localized within the mitochondrial intermembrane space. These findings indicated that SARM1 was activated downstream of mitochondrial dysfunction in ADOA, highlighting it as a promising therapeutic target.

Keywords: Cell biology; Mitochondria; Neurodegeneration; Neuroscience; Therapeutics.


Conflict of interest statement

Conflict of interest: The authors have declared that no conflict of interest exists.

Figures

Figure 1
Figure 1. The Opa1R290Q/+ mutation impairs mitochondrial morphology and cristae structure.
(A) Mouse OPA1 domains (90). MTS, mitochondrial targeting sequence; TM, transmembrane domain; B, bundle signaling element. Schematic was created with BioRender. (B) Representative images of mitochondria in cortical neurons, glial cells, and fibroblasts isolated from Opa1R290Q/+ mice and WT littermate controls. Scale bars: 10 μm. (C) Quantification of mitochondrial length in cortical neurons (n = 16 WT neurons and 15 Opa1R290Q/+ neurons from 2 cultures), glia (n = 51 WT glia and 23 Opa1R290Q/+ glia from 1 culture), and fibroblasts (n = 39 WT cells from 2 experiments and 23 Opa1R290Q/+ cells from 3 experiments). (D) Opa1R290Q/+ fibroblasts grew at a slower rate than did the WT control (n = 6 wells per genotype). Data indicate the mean ± SEM. (E) Fibroblasts GSH/GSSG ratios measured by LC-MS/MS. n = 6 samples per genotype from 2 experiments. redox, reduction-oxidation. (F and G) Representative summed projections of the central slices of cryo-electron tomograms of mitochondria (F) and corresponding 3D segmentations of the entire stack (G). In the Opa1R290Q/+ cell, the OMM (purple in G) has fused, while the IMMs (blue and pink in G) remains separate. Scale bars: 100 nm. (H) Percentage of mitochondria with fused OMM but unfused IMM. The numbers of stalled-fusion/total mitochondria are indicated. (I) Percentage of WT mitochondria (n = 50 WT and 64 Opa1R290Q/+) displaying stacked cristae. (J) Classification of cristae morphology (n = 362 WT and n = 337 Opa1R290Q/+ cristae). (KM) The highest-frequency values for OMM-IMM distance (K), cristae angle relative to the OMM (L), and cristae curvedness (M) (n = 19 WT and 22 Opa1R290Q/+ mitochondria). Box plots denote minimum, first quartile, median, third quartile, and maximum values. *P < 0.05, **P < 0.01, and ****P < 0.0001 by Mann-Whitney U test (C, E, and KM) and 2-way ANOVA with Šidák’s multiple-comparison test (D). ctrl, control; mito, mitochondria.
Figure 2
Figure 2. Age-related RGC and optic nerve degeneration in Opa1R290Q/+ mice.
(A) Representative images of retinal whole mounts from WT and Opa1R290Q/+ mice. Each retina was imaged in every quadrant, approximately 1.2 mm from the optic nerve head. RBPMS (green) marks all RGCs and p-H2Ax (magenta) labels RGCs undergoing cell death (marked by arrowheads). Scale bars: 20 μm. (B) Quantification of dying RGCs over time. Each dot represents 1 retina. The counts of dying RGCs were averaged across the 4 quadrants of each retina and divided by the average RGC number of those quadrants. This value was then normalized to the WT average at each age. n = 9–12 WT and n = 9–14 Opa1R290Q/+ retinas per age group. (C) Quantification of total RGCs over time. Each dot represents 1 retina. RGC counts were first averaged across the 4 quadrants of each retina and then normalized to the WT average at each age. n = 6–10 WT and n = 8–10 Opa1R290Q/+ retinas per age group. (D) Diagram of optic nerve cross-sections and representative EM images from 12MO animals. Arrows indicate degenerating axons. Scale bars: 1 μm. Diagram was created with BioRender. (E) Quantification of degenerating axons. Each dot represents 1 optic nerve. The counts of degenerating axons were averaged across the 9 fields of each cross-section of an optic nerve and divided by the average axon number of those fields. This value was then normalized to the WT average at each age. n = 6–8 WT and n = 8 Opa1R290Q/+ retinas per age group. Box plots denote minimum, first quartile, median, third quartile, and maximum values. *P < 0.05, **P < 0.01, and ***P < 0.001, by Mann-Whitney U test for each age group.
Figure 3
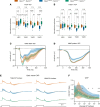
Figure 3. Impaired RGC function in Opa1R290Q/+ mice as measured by ERG and VEP.
(A) Diagram of recording setup: (1) subcutaneous recording electrode for VEP; (2) integrated LED stimulator and recording electrode for ERG; (3) snout reference electrode for VEPs. A ground electrode was inserted subcutaneously next to the tail (not shown). Diagram was created with BioRender. (B) Representative ERG and VEP traces from WT control mice. For flash ERG, the amplitudes of a-waves and b-waves were measured. For flash VEPs and pattern VEPs, the amplitude of N1 was measured. (C and D) Amplitudes of a-waves (C) and b-waves (D) of flash ERGs across ages. Each dot represents 1 animal. Amplitudes were normalized to WT average at each age. n = 15–17 WT and n = 16 Opa1R290Q/+ mice per age group. (E) Average flash ERG traces in 18MO animals. n = 15 WT and n = 16 Opa1R290Q/+ mice. (F) N1 amplitudes of flash VEP across age. Each dot represents 1 animal. Amplitudes were normalized to WT average at each age. n = 16–17 WT and n = 16 Opa1R290Q/+ mice per age group. (G) Average flash VEP traces in 18MO animals. n = 16 WT and n = 16 Opa1R290Q/+ mice. (H) N1 amplitudes of pattern VEP traces across ages. Each dot represents 1 animal. Amplitudes were normalized to the WT average at each age. n = 16–17 WT and n = 16 Opa1R290Q/+ mice per age group. (I) Average pattern VEP traces in 18MO animals. n = 16 WT and 16 Opa1R290Q/+ mice. Box plots (C, D, F, and H) denote minimum, first quartile, median, third quartile, and maximum values. Data in (E, G, and I) indicate the mean ± SEM. **P < 0.01 and ****P < 0.0001, by Mann-Whitney U test for each age group. All data indicate the mean ± SEM.
Figure 4
Figure 4. Abnormal CAPs in the optic nerve of Opa1R290Q/+ mice.
(A) Top: The recording configuration contains the retina (left) and optic nerve (center), with the latter drawn into an electrode. Bottom: Schematic showing the retina, nerve and electrode. (B) Example CAPs from a WT retina. For lower intensities (<10 R*/rod/s), at least 3 trials were typically averaged to increase signal/noise; for brighter intensities, 1 trial sufficed. The stimulus monitor trace is shown at the bottom, with light intensities increasing from bottom to top (indicated on the left in units of R*/rod/s). (C) CAPs (data indicate the mean ± SD) of WT (left, black) and Opa1R290Q/+ (right, blue) retinas. Responses of each retina were normalized to its maximum value at each light intensity. The normalized Opa1R290Q/+ traces (blue) were superimposed on the mean of the normalized WT traces (gray) for comparison. Shorter trials were used for dimmer stimuli, leading to a lack of error bars in some intervals. n = 7 WT and n = 7 Opa1R290Q/+ retinas per age group, except for n = 3 Opa1R290Q/+ retinas at the highest intensity. (D) Ratio of second and first ON peaks (ON P2/P1) from C. The mean ± SD is shown for WT (black) and Opa1R290Q/+ (blue). For the dimmest intensity, distinct peaks were not evident (average z score <10) and were therefore not included in the analyses. *P < 0.05 and ****P < 0.0001, by Mann-Whitney U test with bootstrapping (see Methods).
Figure 5
Figure 5. Sarm1 KO rescues RGC and optic nerve degeneration in Opa1R290Q/+ mice.
(A) Representative images of retinal whole mounts. Arrowheads indicate p-H2Ax+ dying RGCs. Scale bars: 20 μm. (B) Quantification of total RGCs across ages. Each dot represents 1 retina. RGC counts were first averaged across the 4 quadrants of each retina and then normalized to the WT average at each age. n = 10–11 Opa1+/+ Sarm1–/+, n = 10–13 Opa1R290Q/+ Sarm1–/+, and n = 9–11 Opa1R290Q/+ Sarm1–/– retinas per age group. (C) Quantification of degenerating RGCs across ages in the same cohort as in B. Each dot represents 1 retina. The counts of dying RGCs were averaged across the 4 quadrants of each retina and divided by the average RGC number of those quadrants. This value was then normalized to the WT average at each age. (D) Representative EM images of cross-sections of optic nerves. Arrows indicate degenerating RGC axons. Boxed areas are enlarged in lower panels. Scale bars: 1 μm. (E) Percentage of degenerating RGC axons quantified from EM images from 12MO animals. n = 7 Opa1+/+ Sarm1–/+, n = 6 Opa1R290Q/+ Sarm1–/+, and n = 6 Opa1R290Q/+ Sarm1–/– optic nerves. Box plots denote minimum, first quartile, median, third quartile, and maximum values. *P < 0.05, **P < 0.01, and ****P < 0.0001, by 1-way ANOVA followed by Tukey’s multiple-comparison test for each age group.
Figure 6
Figure 6. Sarm1 KO rescues the decline in RGC function in Opa1R290Q/+ mice.
(A and B) Quantification of N1 amplitudes of flash VEPs and pattern VEPs measured at the indicated ages of the cohorts. Each dot represents 1 animal. Amplitudes were normalized to the WT average at each age. n = 15–18 Opa1+/+ Sarm1–/+, n = 16–17 Opa1R290Q/+ Sarm1–/+, and n = 15–17 Opa1R290Q/+ Sarm1–/– mice per age group. One-way ANOVA followed by Tukey’s multiple-comparison test. Box plots denote minimum, first quartile, median, third quartile, and maximum values. (C and D) Average flash VEP and pattern VEP traces in 18MO animals. Data indicate the mean ± SEM. (E) Normalized CAP traces from the 3 genotypes at the 2 highest light intensities. Data indicate the mean ± SD. Stimulus monitor traces are shown at the bottom. The Opa1+/+ Sarm1–/+ traces were superimposed onto the other 2 groups for comparisons. n = 4–5 Opa1+/+ Sarm1–/+, n = 8–9 Opa1R290Q/+ Sarm1–/+, and n = 7 Opa1R290Q/+ Sarm1–/– retinas. (F) Ratio of the second and first ON peaks (ON P2/P1) as a function of light intensities from E. Data indicate the mean ± SD. Mann-Whitney U test with bootstrapping (see Methods). P values for all comparisons are presented in the Supporting Data Values file. *P < 0.05, **P < 0.01, ***P < 0.001, and ****P < 0.0001; #P < 0.05 between Opa1+/+ Sarm1–/+ and Opa1R290Q/+ Sarm1–/+ retinas; and P < 0.05 between Opa1R290Q/+ Sarm1–/+ and Opa1R290Q/+ Sarm1–/– retinas.
Figure 7
Figure 7. SARM1 is present in the mitochondrial IMS and IMM, and its KO does not rescue mitochondrial fragmentation.
(A) Confocal images of overexpressed SARM1 and the mitochondrial matrix marker MitoDsRed in cortical neurons show mitochondrial localization of SARM1 in both WT and Opa1R290Q/+ neurons. MAP2 staining is shown in blue. Scale bars: 10 μm. (B) Western blot of SARM1, TOMM20, TIM23, cytochrome C (Cyt C), and HSP60 in the cytosolic and crude mitochondrial fractions from WT whole brain tissues. (C) Diagram depicting localization of the marker proteins across different mitochondrial compartments. (D) PK protection assay on crude mitochondrial fractions from WT whole brain samples. (E) Quantification of SARM1 abundance across 6 conditions. n = 4 mice from 4 experiments. Protein levels were normalized to the control condition in each experiment. Data indicate the mean ± SEM. (F) Representative confocal images of mitochondria in expanded cortical neurons (DIV8–DIV9) isolated from Opa1+/+ Sarm1–/+, Opa1R290Q/+ Sarm1–/+, and Opa1R290Q/+ Sarm1–/– mice. Mitochondria are labeled with MitoDsRed. Scale bars: 10 μm. (G) Quantification of mitochondria length in OPA1 Sarm1 cortical neurons shows no rescue of fragmentation by Sarm1 KO (n = 33 Opa1+/+ Sarm1–/+, 24 Opa1R290Q/+ Sarm1–/+, and 38 Opa1R290Q/+ Sarm1–/– neurons from 4 experiments). Box plots denote minimum, first quartile, median, third quartile, and maximum values. **P < 0.01 and ****P < 0.0001, by 1-way ANOVA with Tukey’s multiple-comparison test (E and G). Tx, Triton X-100.

References

    1. Lenaers G, et al. Dominant optic atrophy. Orphanet J Rare Dis. 2012;7:46. doi: 10.1186/1750-1172-7-46. - DOI - PMC - PubMed
    1. Yu-Wai-Man P, et al. The prevalence and natural history of dominant optic atrophy due to OPA1 mutations. Ophthalmology. 2010;117(8):1538–1546. doi: 10.1016/j.ophtha.2009.12.038. - DOI - PMC - PubMed
    1. Yu-Wai-Man P, et al. Inherited mitochondrial optic neuropathies. J Med Genet. 2009;46(3):145–158. doi: 10.1136/jmg.2007.054270. - DOI - PMC - PubMed
    1. Lenaers G, et al. Dominant optic atrophy: culprit mitochondria in the optic nerve. Prog Retin Eye Res. 2021;83:100935. doi: 10.1016/j.preteyeres.2020.100935. - DOI - PubMed
    1. Alexander C, et al. OPA1, encoding a dynamin-related GTPase, is mutated in autosomal dominant optic atrophy linked to chromosome 3q28. Nat Genet. 2000;26(2):211–215. doi: 10.1038/79944. - DOI - PubMed

MeSH terms