. 2025 May 9;11(19):eadv4356.
doi: 10.1126/sciadv.adv4356. Epub 2025 May 9.

Structural maturation of the matrix lattice is not required for HIV-1 particle infectivity

Affiliations

Structural maturation of the matrix lattice is not required for HIV-1 particle infectivity

Long Chen et al. Sci Adv. .

Abstract

During HIV-1 maturation, the matrix (MA) lattice underlying the viral membrane undergoes a structural rearrangement, and the newly released capsid (CA) protein forms a mature CA. While it is well established that CA formation is essential for particle infectivity, the functional role of MA structural maturation remains unclear. Here, we examine maturation of an MA triple mutant, L20K/E73K/A82T, which, despite replicating similarly to wild-type (WT) in some cell lines, exhibits distinct biochemical behaviors that suggest altered MA-MA interactions. Cryo-electron tomography with subtomogram averaging reveals that, although the MA lattice in immature L20K/E73K/A82T virions closely resembles that of the WT, mature L20K/E73K/A82T virions lack a detectable MA lattice. All-atom molecular dynamics simulations suggest that this absence results from destabilized inter-trimer MA interactions in mature L20K/E73K/A82T mutant virions. These findings suggest that an ordered, membrane-associated mature MA lattice is not essential for HIV-1 infectivity, providing insights into the structural requirements for HIV-1 particle maturation and generation of infectious particles.


Figures

Fig. 1.
Fig. 1.. MA-L20K/E73K/A82T exhibits strong MA-MA interactions.
(A to C) Gag processing, Env expression, and incorporation. (A) Cell and virion-associated proteins derived from 293 T cells transfected with WT or MA-mutant pNL4-3 molecular clones were probed with anti-Gag Ab and anti-Env (gp41) antibody (Ab). (B) Virion-associated proteins were probed with anti-p17 (MA) polyclonal Ab. Representative Western blots from three independent experiments are shown. (C) Quantification of p17 monomer/dimer/trimer levels from Western blots in (B). The data are shown as means ± SEM from three independent experiments with statistical significance indicated (*P < 0.05; Student’s t test). (D and E) Membrane stripping assay using the indicated concentration of NP-40. (D) Representative Western blots from three experiments. (E) Quantification of p17 monomer levels from Western blots in (D), indicating the % of p17 retained following detergent treatment relative to the amount present in the absence of detergent. The data are shown as means ± SEM from three independent experiments with statistical significance indicated (*P < 0.05; Student’s t test). (F) Sedimentation analysis in a 10 to 70% sucrose gradient after stripping the viral membrane with 0.075% NP-40. Representative Western blots from three independent experiments are shown. (G) Sedimentation analysis in 3 to 60% OptiPrep gradient after stripping the viral membrane with 1% Triton X-100 (TX-100). Representative Western blots from three independent experiments are shown. The Western blots of the gradient fractions were analyzed using anti-Gag Ab for both the WT and mutant MA. P, pellet fraction. The core fraction highlighted in red was determined by RT assay (fig. S1B). (H and I) Quantification of p24 (H) and p17 (I) monomer levels from Western blots in (G). The data are shown as means ± SEM from three independent experiments.
Fig. 2.
Fig. 2.. Cryo-ET of immature and mature HIV-1 VLPs of WT and L20K/E73K/A82T MA mutant.
(A to D) Cryo-ET central slices of immature WT [(A) and (B)] and mutant [(C) and (D)] particles, enhanced by summing 10 neighboring slices. The density appears in black with the MA layer and CA layer highlighted by brown and blue arrowheads, respectively. (E to J) Computational slices through tomographic reconstructions of mature WT [(E) to (G)] and L20K/E73K/A82T mutant [(H) to (J)] particles. [(F), (G), (I) and (J)] Central slices enhanced by summing 10 neighboring slices, displaying side views of conical capsid cores, denoted by blue arrowheads, and MA layers beneath the inner membrane marked by brown arrowheads. The WT shows a regular lattice pattern, while the mutant exhibits disorganized density. Top views [(E) and (H)] focus on slices near the inner membrane surface, showing disrupted MA lattice density in the mutant (H) compared to the regular MA lattice in the WT (E). Gold fiducial markers have been removed from the images for clarity. (K to N) The Env-containing tomographic slices from mature WT [(K) and (L)] and mutant [(M) and (N)] VLPs. Brown arrowheads indicate the MA lattice, and red arrowheads highlight the Env glycoproteins. Scale bars, 100 nm.
Fig. 3.
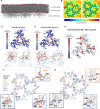
Fig. 3.. Comparison of immature WT and L20K/E73K/A82T MA mutant.
(A and B) Subtomogram averaging maps of the MA trimer for WT (A) and mutant (B) are shown as gray isosurfaces, viewed from the top toward the virus center. The 7OVQ molecular model (18) was fitted into both maps as a rigid body. In the WT, the model is colored from blue (N terminus) to red (C terminus), while, in the mutant, the mutations are highlighted in green. (C and D) The differential density maps, calculated as mutant minus WT, reveal statistically significant changes at a 1% false discovery rate threshold. The green density marks the locations of mutations. Red and blue, respectively, indicate regions of disappearing and appearing density. (E and F) Surface electrostatic potential of the MA trimer, derived from Alphafold2-multimer predictions in Colab (109, 110) and MD simulations, is displayed for the WT (E) and mutant (f). Red and blue represent negatively and positively charged areas, respectively. (G and H) Comparative analysis of trimer-trimer pairings in tomographic reconstructions between the WT (blue) and mutant (orange). The MA-MA distance for WT averaged 59.3 Å with a SD of 5.2 Å, while the mutant recorded 59.2 Å with a SD of 5.0 Å. Tilt angles for the WT were 7.6° (SD 3.9°) versus the mutant’s 8.1° (SD 4.2°). (I to L) Radial registration analysis between the MA trimer and CA hexamer after mapping back the refined positions and orientations. The MA trimers (n = 8000 for both WT and mutant) were projected onto the CA layer to identify intersection points. A heatmap of these intersection points relative to the CA hexamer shows a denser concentration of MA-CA registration in the mutant (J) compared to the WT (I). Representative reconstruction maps illustrate the spatial positioning of MA-CA interactions for the WT (K) and mutant (L).
Fig. 4.
Fig. 4.. Lipid interactions with the immature MA lattice from molecular dynamic simulations.
(A) Model of the immature WT MA lattice embedded in an asymmetric lipid membrane of native HIV-1 lipidomics composition. (B) Time average map of lateral lipid displacement over 1 μs for the membrane in complex with immature WT MA lattice (left) or the immature L20K/E73K/A82T MA lattice (right). The average position of MA is colored in black. (C) Top: WT MA trimer colored by lipid contact occupancy. Bottom: Representative protein-lipid interactions of positively charged residues (black) in the HBR and helix 2 with intravirion leaflet lipids (tan). (D) Top: L20K/E73K/A82T MA trimer colored by lipid contact occupancy. Bottom: Interaction of residues at the HBR and E73K from helix 4 with intravirion leaflet lipids. (E) L20K/E73K/A82T MA trimer, colored by the difference in lipid contact occupancy with respect to WT MA. (F and G) Per-lipid occupancy maps for the intravirion leaflet lipid headgroups in the presence of (F) WT MA or (G) L20K/E73K/A82T MA. Insets show specific interactions between PI(4,5)P2 and PI(4)P lipids in the membrane, with E39 and E73 (Na + ion coordination) and R42 (salt-bridge) at the WT MA trimer centers while lipid-residue interaction at L20K/E73K/A82T MA trimer centers coordinated by R42 are nonspecific. Lipid abbreviations for non-PIP lipids follow the CHARMM nomenclature: PAPE, 1-palmitoyl-2-arachidonyl-phosphatidylethanolamine; PDOPE, 1-palmitoyl-2-docosahexaenoyl-phosphatidylethanolamine; SDPE, 1-stearoyl-2-docosahexaenoyl-phosphatidylethanolamine; 1-PLPS, palmitoyl-2-linoleoyl-phosphatidylserine; SDPS, 1-stearoyl-2-docosahexaenoyl-phosphatidylserine.
Fig. 5.
Fig. 5.. Analysis of mature MA lattice.
(A to D) Radial density profiles and distances of immature WT (blue) and mutant (orange) VLPs, measured from the OL of viral membrane. Profiles are aligned to the OL (the first valley). Representative central slices of immature WT (A) and L20K/E73K/A82T mutant (B) VLPs, enhanced by summing 10 neighboring slices, are demonstrated. Comparison of radial density profiles and distances between valleys and OL are plotted [(C) and (D)], revealing similar profiles and stable Gag protein organization during membrane assembly. Slight differences in the distances from IL/MA, N-terminal domain (NTD), C-terminal domain (CTD), and NC to OL suggest that the mutant Gag shifts slightly toward IL. This indicates a potential increase in membrane binding affinity for the mutant. (E to H) Radial density profiles and distances of mature WT and L20K/E73K/A82T mutant VLPs, measured from the OL of viral membrane. Representative central slice of mature WT (E) and mutant (F) VLPs, enhanced by summing 10 adjacent slices, is presented. Comparison of radial density profiles and distances between valleys and OL are plotted [(G) and (H)], displaying an additional valley further away from the OL in mutant VLPs. Each analysis includes over 20 complete VLPs per sample, with defocus values ranging from 4 to 5 μm. Scale bars, 100 nm.
Fig. 6.
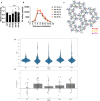
Fig. 6.. MD simulations of mature MA interfaces.
(A to C) Mature MA lattice and inter-trimer interactions for WT MA (A), L20K MA (B), and L20K/E73K/A82T MA (C). (D) MA trimer-trimer distance distributions through lattice perturbation MD simulations. (E) Mature MA intertrimer estimated binding affinity compared to WT MA trimer interfaces via MM-GBSA calculations.
Fig. 7.
Fig. 7.. Mutations at the inter-MA trimer interface do not impair HIV-1 infectivity.
(A) Single-cycle, cell-free viral infectivity of the indicated MA mutants. RT-normalized virus stocks were used to infect TZM-bl cells. Luciferase activity was measured at 48 hours postinfection. Relative infectivity is shown, normalized to 1 for WT NL4-3. Data from at least three independent experiments are shown as means ± SEM. n.s., not significant, one-sample t test. (B) Replication kinetics of the indicated MA mutants. The H9 T cell line was transfected with WT NL4-3 or the indicated MA-mutant proviral clones. Virus replication kinetics were monitored by measuring RT activity at the indicated time points. Data are representative of three independent experiments. (C) Mature MA lattice showcasing the position of the mutations in the MA inter-trimer interfaces. (D) MA trimer-trimer distance distributions for each salt-bridge–disrupting mutation R19A, R19L, E41A, and E51A through six replicas of MA lattice perturbation MD simulations. (E) Estimated mature MA intertrimer binding affinity compared to WT MA trimer interfaces via MM-GBSA calculations.

Update of

References

    1. Datta S. A., Heinrich F., Raghunandan S., Krueger S., Curtis J. E., Rein A., Nanda H., HIV-1 Gag extension: Conformational changes require simultaneous interaction with membrane and nucleic acid. J. Mol. Biol. 406, 205–214 (2011). - PMC - PubMed
    1. C. Aiken, P. Zhang, in Advances in HIV-1 Assembly and Release (Springer, 2013), pp. 153–166.
    1. Kleinpeter A. B., Freed E. O., HIV-1 maturation: Lessons learned from inhibitors. Viruses 12, 940 (2020). - PMC - PubMed
    1. Sundquist W. I., Krausslich H. G., HIV-1 assembly, budding, and maturation. Cold Spring Harb. Perspect. Med. 2, a006924 (2012). - PMC - PubMed
    1. Datta S. A., Curtis J. E., Ratcliff W., Clark P. K., Crist R. M., Lebowitz J., Krueger S., Rein A., Conformation of the HIV-1 Gag protein in solution. J. Mol. Biol. 365, 812–824 (2007). - PMC - PubMed

MeSH terms

Substances