. 2025 May 9;11(19):eadn2528.
doi: 10.1126/sciadv.adn2528. Epub 2025 May 9.

Kinome screening identifies integrated stress response kinase EIF2AK1/HRI as a negative regulator of PINK1 mitophagy signaling

Affiliations

Kinome screening identifies integrated stress response kinase EIF2AK1/HRI as a negative regulator of PINK1 mitophagy signaling

Pawan K Singh et al. Sci Adv. .

Abstract

Loss-of-function mutations in the PINK1 kinase lead to early-onset Parkinson's disease (PD). PINK1 is activated by mitochondrial damage to phosphorylate ubiquitin and Parkin, triggering mitophagy. PINK1 also indirectly phosphorylates Rab GTPases, such as Rab8A. Using an siRNA library targeting human Ser/Thr kinases in HeLa cells, we identified EIF2AK1 [heme-regulated inhibitor (HRI) kinase], a branch of the integrated stress response (ISR), as a negative regulator of PINK1. EIF2AK1 knockdown enhances mitochondrial depolarization-induced PINK1 stabilization and phosphorylation of ubiquitin and Rab8A. These results were confirmed in SK-OV-3, U2OS, and ARPE-19 cells. Knockdown of DELE1, an activator of EIF2AK1, produced similar effects. Notably, the ISR inhibitor ISRIB also enhanced PINK1 activation. In human cells with mito-QC mitophagy reporters, EIF2AK1 knockdown or ISRIB treatment increased PINK1-dependent mitophagy without affecting deferiprone-induced mitophagy. These findings suggest that the DELE1-EIF2AK1 ISR pathway is a negative regulator of PINK1-dependent mitophagy. Further evaluation in PD-relevant models is needed to assess the therapeutic potential of targeting this pathway.


Figures
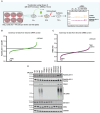
Fig. 1.
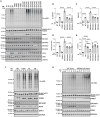
Fig. 1.. siRNA screen to identify kinases that regulate endogenous PINK1-dependent Rab8A phosphorylation.
(A) Schematic of the siRNA knockdown screens used in this study. HeLa cells seeded in six-well plates at 0.5 × 10⁶ cells per well were transfected with siRNA pools (Dharmacon) for 72 hours targeting 428 Ser/Thr kinases with oligomycin (1 μM)/antimycin A (10 μM) (OA) treatment for the last 20 hours of siRNA targeting. Cells were lysed and immunoblotted for indicated antibodies and developed using the LI-COR Odyssey CLx Western blot imaging system for quantitative analysis. h, hours. (B) Summary of data from the kinome screen. The calculated ratio of Rab8A pS111/total Rab8A relative to non-targeting (NT) siRNA control, ranked from the highest increase in Rab8A phosphorylation to the strongest decrease (mean of the two replicates, SD values not shown on the chart, calculated using the LICOR Image Studio software, screening blots provided in figs. S1 to S4). (C) As in (B), the calculated ratio of PINK1/total GAPDH relative to NT siRNA control, ranked from the highest increase in PINK1 levels to the strongest decrease. (D) HeLa cells were transfected with siRNA for 72 hours with the top hit from the screen, EIF2AK1 along with the siRNA for PINK1 and NT siRNA control and OA treatment was done for the last 12 hours of siRNA targeting. Cells were then lysed and immunoblotted with Rab8A pS111, Rab8A, PINK1, Ub pS65, EIF2AK1, OPA1, and GAPDH antibodies and analyzed as described above.
Fig. 2.
Fig. 2.. siRNA knockdown and CRISPR KO of the full-length EIF2AK1 in HeLa cells enhances PINK1 stabilization and activation.
(A) HeLa cells treated with either non-targeting control siRNA pool (NT) or siRNA pool targeting PINK1, EIF2AK1, EIF2AK2, EIF2AK3, and EIF2AK4 for 72 hours were treated with OA in the last 12 hours. Cells were lysed and immunoblotted for Ub pS65, Rab8A, PINK1, EIF2AK1, EIF2AK2, EIF2AK3, EIF2AK4, OPA1, ATF4, and GAPDH, and the immunoblots were developed using the LI-COR Odyssey CLx Western blot imaging system. (B) Quantification of Ub pS65/GAPDH ratio normalized to the ratio in NT (+OA) samples using the Image Studio software. (C) Quantification of PINK1/GAPDH ratio normalized to the ratio in NT (+OA) samples. (D) Quantification of Rab8A pS111/Rab8A ratio normalized to the ratio in NT (+OA) samples. (E) Quantification of ATF4/GAPDH ratio normalized to the ratio in NT (+OA) samples. (F) Wild-type (WT) HeLa cells and HeLa cells transfected with three different sets of CRISPR-Cas9 EIF2AK1 guide RNAs (A pair, G1, and G2) were treated with OA for 12 hours. Cells were lysed and immunoblotted for Ub pS65, PINK1, Rab8A, EIF2AK1, ATF4, OPA1, and GAPDH and developed using the LI-COR Odyssey CLx Western blot imaging system [quantification shown as fig. S8 (A to C)]. (G) Selected EIF2AK1 KO clone A3 and WT HeLa cells treated with OA for 0.5, 1, 3, 6, 9, and 12 hours as above were analyzed for Ub pS65, PINK1, Rab8A, EIF2AK1, ATF4, OPA1, and GAPDH. Data information: [(B) to (E)] All data are means ± SEM; statistical significance is displayed as ***P  0.001; ****P  0.0001; n.s., not significant. n = 4 technical replicates (two biological replicates), one-way ANOVA, Tukey’s multiple comparisons test. h, hours.
Fig. 3.
Fig. 3.. DELE1-EIF2AK1 signaling relay negatively regulates PINK1 stabilization and activation.
(A) HeLa cells either treated with non-targeting control siRNA pool (NT), siRNA pool targeting EIF2AK1, or DELE1 for 72 hours were treated with OA in the last 12 hours. Immunoblot of Ub pS65, Rab8A, PINK1, EIF2AK1, EIF2AK2, EIF2AK4, ATF4, OPA1, and GAPDH. h, hours. (B to E) Quantification for Ub pS65/GAPDH, PINK1/GAPDH, Rab8A pS111/Rab8A and ATF4/GAPDH ratio for (A), normalized to the ratio in NT (+OA) samples. Data information: [(B) to (E)] All data are means ± SEM; statistical significance is displayed as *P ≤ 0.05; **P ≤ 0.01; ****P ≤ 0.0001; n.s., not significant. n = 4 technical replicates (two biological replicates), one-way ANOVA, Tukey’s multiple comparisons test.
Fig. 4.
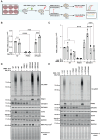
Fig. 4.. Transcriptional up-regulation of PINK1 in EIF2AK1 knockdown cells following mitochondrial depolarization.
(A) Schematic of the siRNA workflow for studying transcriptional and translational regulation of PINK1. (B) HeLa cells either treated with non-targeting control siRNA pool (NT), siRNA pool targeting PINK1, or EIF2AK1for 72 hours were treated with OA in the last 12 hours. Relative mRNA levels of PINK1 measured by RT-PCR in HeLa cells with TBP used as a reference gene. (C) As in (B), relative mRNA levels of PINK1 measured by RT-PCR in HeLa cells with and without co-treatment of transcription inhibitor DRB, using TBP as a reference gene. (D) Corresponding immunoblot analysis for remaining two-thirds of the samples used for RT PCR analysis in (C). Immunoblot of Ub pS65, PINK1, EIF2AK1, EIF2AK2, ATF4, OPA1, GAPDH, RNA POLII phospho-S5 (DRB treatment control), and total protein as visualized by Ponceau S staining. (E) HeLa cells treated with non-targeting control siRNA pool (NT), siRNA pool targeting PINK1, or EIF2AK1for 72 hours were either treated with OA alone or co-treated with translation inhibitor CHX in the last 12 hours. Immunoblot of Ub pS65, PINK1, EIF2AK1, EIF2AK2, ATF4, OPA1, GAPDH, and total protein as visualized by Ponceau S staining. Data information: [(B) and (C)] All data are means ± SEM; statistical significance is displayed as ***P  0.001; ****P  0.0001; n.s., not significant. n = 3 biological replicates, (B) two-way ANOVA, Uncorrected Fisher’s LSD multiple comparisons test and (C) one-way ANOVA, Tukey’s multiple comparisons test. h, hours.
Fig. 5.
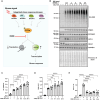
Fig. 5.. Chemical inhibition of the ISR by ISRIB enhances PINK1 stabilization and activation.
(A) Schematic depicting the two outputs of the ISR: reduction in bulk protein synthesis and translational induction of ATF4 and its target genes. ISRIB reverses these effects of the ISR by acting downstream of the ISR kinases phosphorylation of eIF2α. (B) HeLa cells seeded in a 10-cm dish were co-treated with 300 nmol of ISRIB for 3, 6, 12, and 24 hours and OA for 12 hours or OA alone for 12 hours. Representative immunoblot of Ub pS65, PINK1, EIF2AK1, OPA1, GAPDH, ATF4, and total protein as visualized by Ponceau S staining. (C to E) Quantification for Ub pS65/GAPDH, PINK1/GAPDH, and ATF4/GAPDH ratio for (B), normalized to the ratio in untreated (UT) (+OA) samples using the LICOR Image Studio software. Data information: [(C) to (E)] All data are means ± SEM; statistical significance is displayed as **P  0.01; ***P  0.001; ****P  0.0001; n.s., not significant. n = 6 technical replicates (three biological replicates), one-way ANOVA, Tukey’s multiple comparisons test. h, hours.
Fig. 6.
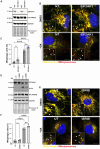
Fig. 6.. Genetic and chemical inhibition of EIF2AK1-mediated ISR enhances PINK1-Parkin–dependent mitophagy.
(A and B) Representative immunoblots (A) or confocal images (B) of ARPE-19 cells stably expressing the mito-QC reporter and HA-Parkin, transfected with non-targeting siRNA (NT) or siRNA targeting EIF2AK1. Three days post-transfection, cells were treated with OA for 2 hours prior to analysis. (C) Quantification of mitophagy shown in (B) from four independent experiments (n = 4 biological replicates with >66 cells per replicate). (D and E) Representative immunoblots (D) or confocal images (E) of ARPE-19 cells stably expressing the mito-QC reporter and HA-Parkin, pretreated for 12 hours with 300 nM ISRIB and treated with OA for 2 hours prior analysis. (F) Quantification of mitophagy shown in (E) from four independent experiments (n = 4 biological replicates with >101 cells per replicate). (C) Two-way ANOVA, Tukey’s multiple comparisons test; and (F) one-way ANOVA, Tukey’s multiple comparisons test. Data information: Enlarged views are shown in the bottom corners, and arrowheads indicate examples of mitolysosomes. Nuclei were stained in blue (Hoechst). Scale bars, 10 μm. Overall data are means ± SD; statistical significance is displayed as **P  0.01; ****P  0.0001; n.s., not significant. DMSO, dimethyl sulfoxide.
Fig. 7.
Fig. 7.. Model depicting negative interplay of DELE1-EIF2AK1/HRI ISR pathway and PINK1 mitophagy signaling.
Upon mitochondrial stress both PINK1 and OMA1 become activated. OMA1 cleaves the inner mitochondrial membrane protein DELE1 to produce a C-terminal fragment (DELE1-cleaved). This accumulates in the cytosol, where it interacts with and activates the ISR kinase EIF2AK1/HRI. EIF2AK1 activation leads to a general reduction in protein translation while allowing the translation of specific mRNAs including the transcription factor ATF4. This leads to inhibition of PINK1 stabilization and mitophagy.

References

    1. Kitada T., Asakawa S., Hattori N., Matsumine H., Yamamura Y., Minoshima S., Yokochi M., Mizuno Y., Shimizu N., Mutations in the parkin gene cause autosomal recessive juvenile parkinsonism. Nature 392, 605–608 (1998). - PubMed
    1. Valente E. M., Abou-Sleiman P. M., Caputo V., Muqit M. M., Harvey K., Gispert S., Ali Z., Del Turco D., Bentivoglio A. R., Healy D. G., Albanese A., Nussbaum R., Gonzalez-Maldonado R., Deller T., Salvi S., Cortelli P., Gilks W. P., Latchman D. S., Harvey R. J., Dallapiccola B., Auburger G., Wood N. W., Hereditary early-onset Parkinson’s disease caused by mutations in PINK1. Science 304, 1158–1160 (2004). - PubMed
    1. Gan Z. Y., Callegari S., Cobbold S. A., Cotton T. R., Mlodzianoski M. J., Schubert A. F., Geoghegan N. D., Rogers K. L., Leis A., Dewson G., Glukhova A., Komander D., Activation mechanism of PINK1. Nature 602, 328–335 (2022). - PMC - PubMed
    1. Kakade P., Ojha H., Raimi O. G., Shaw A., Waddell A. D., Ault J. R., Burel S., Brockmann K., Kumar A., Ahangar M. S., Krysztofinska E. M., Macartney T., Bayliss R., Fitzgerald J. C., Muqit M. M. K., Mapping of a N-terminal α-helix domain required for human PINK1 stabilization, Serine228 autophosphorylation and activation in cells. Open Biol. 12, 210264 (2022). - PMC - PubMed
    1. Lazarou M., Jin S. M., Kane L. A., Youle R. J., Role of PINK1 binding to the TOM complex and alternate intracellular membranes in recruitment and activation of the E3 ligase Parkin. Dev. Cell 22, 320–333 (2012). - PMC - PubMed

LinkOut - more resources