Comparative Study
. 2025 May;21(5):e70012.
doi: 10.1002/alz.70012.

Comparative mapping of single-cell transcriptomic landscapes in neurodegenerative diseases

Affiliations
Comparative Study

Comparative mapping of single-cell transcriptomic landscapes in neurodegenerative diseases

E Keats Shwab et al. Alzheimers Dement. 2025 May.

Abstract

Introduction: Alzheimer's disease (AD), dementia with Lewy bodies (DLB), and Parkinson's disease (PD) represent a spectrum of neurodegenerative diseases (NDDs). Here, we performed the first direct comparison of their transcriptomic landscapes.

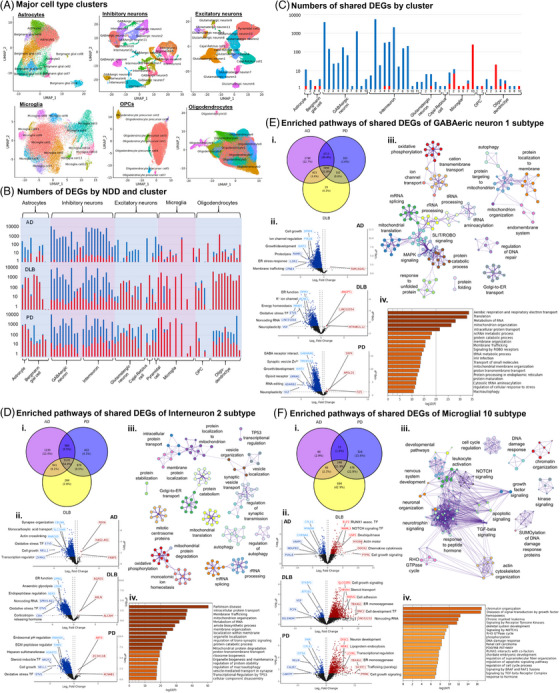
Methods: We profiled whole transcriptomes of NDD cortical tissue by single-nucleus RNA sequencing, using computational analyses to identify common and distinct differentially expressed genes (DEGs), pathways, vulnerable and disease-driver cell subtypes, and altered cell-to-cell interactions.

Results: The same inhibitory neuron subtype was depleted in both AD and DLB. Potentially disease-driving neuronal cell subtypes were identified in both PD and DLB. Cell-cell communication was predicted to be increased in AD but decreased in DLB and PD. DEGs were most commonly shared across NDDs within inhibitory neuron subtypes. Overall, AD and PD showed greatest transcriptomic divergence, while DLB exhibited an intermediate signature.

Discussion: These results may help explain the clinicopathological spectrum of these NDDs and provide unique insights into shared and distinct molecular mechanisms underlying pathogenesis.

Highlights: The same vulnerable inhibitory neuron subtype population was depleted in both Alzheimer's disease (AD) and dementia with Lewy bodies (DLB). Potentially disease-driving neuronal cell subtypes were discovered in both Parkinson's disease (PD) and DLB. Cell-cell communication was predicted to be increased in AD but decreased in DLB and PD. Differentially expressed genes were most commonly shared across neurodegenerative diseases in inhibitory neuron types. AD and PD had the greatest transcriptomic divergence, with DLB showing an intermediate signature.

Keywords: Alzheimer's disease; Parkinson's disease; cell communication; comparative; dementia with Lewy bodies; single‐nucleus RNA sequencing; synucleopathies; transcriptomics; vulnerable cell types.


Conflict of interest statement

None. Author disclosures are available in the supporting information.

Figures

FIGURE 1
FIGURE 1
Elucidating similarities and differences in transcriptomic landscapes underlying shared and distinct pathologic attributes of AD, PD, and DLB. A, Convergence of disease attributes across NDDs. Dementia is a defining symptom of both AD and DLB but may also be present in PD, while motor deterioration is a primary symptom of PD and DLB but may also be present in AD. Lewy bodies are a hallmark of both PD and DLB, but are also present in more than half of AD cases, while tau and Aβ, hallmarks of AD, are often present in DLB, and tau is a common component of Lewy bodies. APOE variants represent the highest genetic risk factor for AD, but mutations have also been linked to DLB risk and cognitive decline in PD. SNCA is primarily associated with PD and DLB, but mutations in this gene are also are associated with increased risk of AD. Furthermore, numerous GWAS identified risk alleles show overlap across all three NDDs. B, Comparison of NDD transcriptomic landscapes via snRNA‐seq. TC samples from 12 donors diagnosed with AD, DLB, and PD, as well as normal controls, were used for snRNA‐seq analysis, followed by integration of transcriptomic datasets and cell type annotation. Datasets were examined for depletion of neuronal cell subtypes in each NDD compared to NC nuclei, identification of disease‐driver cell types with enriched expression of GWAS genes, changes in cell‐to‐cell communication between cell subtypes in NDD and NC nuclei, shared genes differentially expressed in each NDD compared to NC nuclei, and differential gene expression between each pair of NDDs. Aβ, amyloid beta; AD, Alzheimer's disease; APOE, apolipoprotein E; DLB, dementia with Lewy bodies; GWAS, genome‐wide association study; NC, normal control; NDD, neurodegenerative disease; PD, Parkinson's disease; snRNA‐seq, single‐nucleus RNA sequencing; TC, temporal cortex.
FIGURE 2
FIGURE 2
Characterization of vulnerable depleted cell subtypes in each NDD. A, Uniform Manifold Approximation and Projection for Dimension Reduction plots of neuronal nuclei of each NDD integrated with NC nuclei. Smaller plots are color coded to indicate excitatory neurons (Exc) and inhibitory neurons (Inh). Larger plots are color coded to indicate cell subtype clusters. Depleted clusters are circled in red and labeled. B, Unbiased volcano plots for depleted cell subtype clusters. Log2 fold change (FC) between depleted cluster nuclei and other nuclei of the same major cell type is plotted against –log10 P value (FDR). Points representing DEGs with statistically significant (FDR < 0.05) upregulation in NDD are shown in dark red while DEGs with significant downregulation are shown in dark blue. Genes without significantly differential expression are shown as gray points. The three DEGs with the highest absolute fold change (log2FC > 0.2) in the up‐ and downregulated categories are labeled in dark red and dark blue, respectively. The three DEGs within 500  kb of NDD‐associated single nucleotide polymorphisms previously identified in GWAS (GWAS‐DEG) with the highest absolute log2FC in the up‐ and downregulated categories are labeled in bright red and bright blue, respectively. C, Metascape network plots of biological pathways enriched among genes upregulated (positive markers) and downregulated (negative markers) within depleted cell subtypes compared to cell subtypes of the same major cell type that were not depleted. Nodes represent specific biological pathways clustered by shared gene membership. Clusters with similar biological function are color coded and labeled according to general function. Node sizes are proportional to the number of differential‐interacting genes in the pathway, and line width connecting nodes is proportional to shared gene membership in linked pathways. D, Violin plots of log‐normalized count data showing expression of the GWAS‐DEGs (bordered in pink and light blue) and 9 overall DEGs (bordered in red and dark blue) with the highest absolute fold change in depleted clusters compared to clusters of the same major cell type that were not depleted. Basic functional category information is indicated for each gene. AD, Alzheimer's disease; DEG, differentially expressed gene; DLB, dementia with Lewy bodies; FDR, false discovery rate; GWAS, genome‐wide association study; NC, normal control; NDD, neurodegenerative disease; PD, Parkinson's disease.
FIGURE 3
FIGURE 3
Identification of disease‐driver cell subtypes with enriched GWAS risk gene expression. A, Uniform Manifold Approximation and Projection for Dimension Reduction plots of neuronal nuclei of each NDD integrated with NC nuclei. Smaller plots are color coded to indicate subtypes below (False) and above (True) the AUCell pass threshold for enriched expression of genes within 500  kb of NDD‐associated single nucleotide polymorphisms previously identified in GWAS (GWAS genes). B, Bar charts showing total numbers of cells in each subtype cluster (blue) and numbers of cells above the AUCell pass threshold for enriched GWAS gene expression (red). C, Metascape network plots of biological pathways enriched among GWAS genes upregulated within disease‐driver cell subtypes compared to cell subtypes of the same major cell type that were not enriched for GWAS gene expression. Nodes represent specific biological pathways clustered by shared gene membership. Clusters with similar biological function are color coded and labeled according to general function. Node sizes are proportional to the number of differential‐interacting genes in the pathway, and line width connecting nodes is proportional to shared gene membership in linked pathways. D, Violin plots of log‐normalized count data showing expression of the GWAS‐DEGs with the highest positive fold change in disease‐driver clusters compared to clusters of the same major cell type that were not disease‐driving. Basic functional category information is indicated for each gene. AD, Alzheimer's disease; DEG, differentially expressed gene; DLB, dementia with Lewy bodies; FDR, false discovery rate; GWAS, genome‐wide association study; NC, normal control; NDD, neurodegenerative disease; PD, Parkinson's disease.
FIGURE 4
FIGURE 4
Differential interaction strength between cell subtypes in NDDs versus normal nuclei. Ai, CellChat heatmaps showing degree of overall change in interaction strength between all pairs of cell subtypes for each NDD. Red indicates increased interaction in NDD, blue indicates decreased interaction. Aii, CellChat network diagram showing cell types with the highest differential interaction strength based on fold change in receptor‐ligand expression in NDD nuclei compared to NC. Lines between cell types indicate significantly altered interaction, with red lines indicating increased interaction strength in NDD and blue lines representing decreased interaction strength. Line width is proportional to statistical significance of change in interaction strength. Larger and bold labels indicate cell types with more prominently altered interactions. Bi, Metascape network plot of biological pathways enriched among genes associated with increased interaction strength in AD across all cell types. Nodes represent specific biological pathways clustered by shared gene membership. Clusters with similar biological function are color coded and labeled according to general function. Node sizes are proportional to the number of differential‐interacting genes in the pathway, and line width connecting nodes is proportional to shared gene membership in linked pathways. Bii, Heatmap of top 20 enriched pathways among interactions increased in AD across all cell types. Interacting cell types are indicated, with sending type listed first and receiving type indicated second. Color saturation is proportional to strength of enrichment. Ci, Metascape network plot of biological pathways enriched among genes associated with increased interaction strength in DLB across all cell types. Cii, Heatmap of top 20 enriched pathways among interactions increased in DLB across all cell types. Di, Metascape network plot of biological pathways enriched among genes associated with increased interaction strength in PD across all cell types. Dii, Heatmap of top 20 enriched pathways among interactions increased in PD across all cell types. AD, Alzheimer's disease; DLB, dementia with Lewy bodies; GWAS, genome‐wide association study; NC, normal control; NDD, neurodegenerative disease; PD, Parkinson's disease.
FIGURE 5
FIGURE 5
Differential gene expression shared by three pathologies on cell subtype level. A, Uniform Manifold Approximation and Projection for Dimension Reduction plots of integrated NDD and NC nuclei of each major cell type, color coded to indicate cell subtype clusters. B, Bar charts representing numbers of DEGs identified in each cell subtype within each NDD compared to NC nuclei of the same subtype. Red indicates DEGs upregulated in NDDs and blue indicates DEGs downregulated in NDDs. C, Bar chart representing numbers of DEGs shared between all three NDDs compared to NC nuclei for each cell subtype. Red indicates DEGs upregulated in NDDs and blue indicates DEGs downregulated in NDDs. Di, Venn diagram showing overlap between DEGs downregulated in each NDD within the Interneuron 2 subtype. Dii, Unbiased volcano plots for GABAergic neuron 1 subtype gene expression in each NDD. Log2 fold change (FC) between NDD nuclei and NC nuclei of the same subtype is plotted against –log10 P value (FDR). Points representing DEGs with statistically significant (FDR < 0.05) upregulation in NDD are shown in dark red while DEGs with significant downregulation are shown in dark blue. Genes without significantly differential expression are shown as gray points. The three DEGs with the highest absolute fold change (log2FC > 0.2) in the up‐ and downregulated categories are labeled in dark red and dark blue, respectively. The three DEGs within 500  kb of NDD‐associated SNPs previously identified in GWAS (GWAS‐DEG) with the highest absolute log2FC in the up‐ and downregulated categories are labeled in bright red and bright blue, respectively. Basic functional category information is indicated for each labeled GWAS‐DEG. Diii, Metascape network plots of biological pathways enriched among DEGs downregulated in all NDDs within the GABAergic neuron 1 subtype. Nodes represent specific biological pathways clustered by shared gene membership. Clusters with similar biological function are color coded and labeled according to general function. Node sizes are proportional to the number of differential‐interacting genes in the pathway, and line width connecting nodes is proportional to shared gene membership in linked pathways. Div, Metascape bar chart showing the top 20 most highly enriched biological pathway terms among DEGs downregulated across all NDDs within the GABAergic neuron 1 subtype. Statistical significance (Log10 P value) is plotted on horizontal axes. Darker‐colored bars indicated greater significance. Ei, Venn diagram showing overlap between DEGs downregulated in each NDD within the GABAergic neuron 1 subtype. Eii, Unbiased volcano plots for Interneuron 2 subtype gene expression in each NDD. Eiii, Metascape network plots of biological pathways enriched among DEGs upregulated in all NDDs within the Interneuron 2 subtype. Eiv, Metascape bar chart showing the top 20 most highly enriched biological pathway terms among DEGs downregulated across all NDDs within the Interneuron 2 subtype. Fi, Venn diagram showing overlap between DEGs upregulated in each NDD within the Microglia 10 subtype. Fii, Unbiased volcano plots for Microglia 10 subtype gene expression in each NDD. Fiii, Metascape network plots of biological pathways enriched among DEGs upregulated in all NDDs within the Microglia 10 subtype. Fiv, Metascape bar chart showing the top 20 most highly enriched biological pathway terms among DEGs upregulated across all NDDs within the Microglia 10 subtype. AD, Alzheimer's disease; DEG, differentially expressed gene; DLB, dementia with Lewy bodies; FDR, false discovery rate; GWAS, genome‐wide association study; NC, normal control; NDD, neurodegenerative disease; PD, Parkinson's disease.
FIGURE 6
FIGURE 6
Differential gene expression between NDDs in cell subtypes. A, Uniform Manifold Approximation and Projection for Dimension Reduction dimensional reduction plots of integrated pairs of NDD nuclei of all cell types, color coded to indicate cell subtype clusters. B, Bar charts representing numbers of DEGs identified using NEBULA for each cell subtype between nuclei of the indicated NDD pairs within the same subtype. Red and blue bars represent DEGs upregulated in one or the other NDD, as indicated. Ci, Unbiased volcano plots showing gene expression in selected cell subtypes in the AD and DLB comparison. Log2 fold change (FC) between nuclei of the 2 NDDs in the same subtype is plotted against –log10 P value (FDR). Points representing DEGs with statistically significant (FDR < 0.05) upregulation in AD are shown in dark blue while DEGs with significant upregulation in DLB are shown in dark red. Genes without significantly differential expression are shown as gray points. The three DEGs with the highest absolute fold change (log2FC > 0.2) in the AD and DLB upregulated categories are labeled in dark blue and dark red, respectively. The three DEGs within 500  kb of NDD‐associated single nucleotide polymorphisms previously identified in GWAS (GWAS‐DEG) exclusive to AD, exclusive to DLB, and common to both NDDs with the highest absolute log2FC in the up‐ and downregulated categories are labeled in bright red and bright blue, respectively, and the NDDs associated with each GWAS‐DEG are indicated. Basic functional category information is indicated for each labeled GWAS‐DEG. Cii, Heatmap of top 20 enriched pathways among interactions increased in DLB compared to AD across all cell types. Color saturation is proportional to statistical significance of enrichment. Di, Unbiased volcano plots showing gene expression in selected cell subtypes in the PD and DLB comparison. Color coding indicates upregulation in the indicated NDD. The top three GWAS‐DEGs exclusive to PD, exclusive to DLB, and common to both NDDs are indicated. Dii, Heatmap of top 20 enriched pathways among interactions increased in DLB compared to PD across all cell types. Ei, Unbiased volcano plots showing gene expression in selected cell subtypes in the AD and PD comparison. Color coding indicates upregulation in the indicated NDD. The top three GWAS‐DEGs exclusive to AD, exclusive to PD, and common to both NDDs are indicated. Eii, Heatmap of top 20 enriched pathways among interactions increased in PD compared to AD across all cell types. Eiii, Heatmap of top 20 enriched pathways among interactions increased in AD compared to PD across all cell types. AD, Alzheimer's disease; DEG, differentially expressed gene; DLB, dementia with Lewy bodies; FDR, false discovery rate; GWAS, genome‐wide association study; NC, normal control; NDD, neurodegenerative disease; PD, Parkinson's disease.
FIGURE 6
FIGURE 6
Differential gene expression between NDDs in cell subtypes. A, Uniform Manifold Approximation and Projection for Dimension Reduction dimensional reduction plots of integrated pairs of NDD nuclei of all cell types, color coded to indicate cell subtype clusters. B, Bar charts representing numbers of DEGs identified using NEBULA for each cell subtype between nuclei of the indicated NDD pairs within the same subtype. Red and blue bars represent DEGs upregulated in one or the other NDD, as indicated. Ci, Unbiased volcano plots showing gene expression in selected cell subtypes in the AD and DLB comparison. Log2 fold change (FC) between nuclei of the 2 NDDs in the same subtype is plotted against –log10 P value (FDR). Points representing DEGs with statistically significant (FDR < 0.05) upregulation in AD are shown in dark blue while DEGs with significant upregulation in DLB are shown in dark red. Genes without significantly differential expression are shown as gray points. The three DEGs with the highest absolute fold change (log2FC > 0.2) in the AD and DLB upregulated categories are labeled in dark blue and dark red, respectively. The three DEGs within 500  kb of NDD‐associated single nucleotide polymorphisms previously identified in GWAS (GWAS‐DEG) exclusive to AD, exclusive to DLB, and common to both NDDs with the highest absolute log2FC in the up‐ and downregulated categories are labeled in bright red and bright blue, respectively, and the NDDs associated with each GWAS‐DEG are indicated. Basic functional category information is indicated for each labeled GWAS‐DEG. Cii, Heatmap of top 20 enriched pathways among interactions increased in DLB compared to AD across all cell types. Color saturation is proportional to statistical significance of enrichment. Di, Unbiased volcano plots showing gene expression in selected cell subtypes in the PD and DLB comparison. Color coding indicates upregulation in the indicated NDD. The top three GWAS‐DEGs exclusive to PD, exclusive to DLB, and common to both NDDs are indicated. Dii, Heatmap of top 20 enriched pathways among interactions increased in DLB compared to PD across all cell types. Ei, Unbiased volcano plots showing gene expression in selected cell subtypes in the AD and PD comparison. Color coding indicates upregulation in the indicated NDD. The top three GWAS‐DEGs exclusive to AD, exclusive to PD, and common to both NDDs are indicated. Eii, Heatmap of top 20 enriched pathways among interactions increased in PD compared to AD across all cell types. Eiii, Heatmap of top 20 enriched pathways among interactions increased in AD compared to PD across all cell types. AD, Alzheimer's disease; DEG, differentially expressed gene; DLB, dementia with Lewy bodies; FDR, false discovery rate; GWAS, genome‐wide association study; NC, normal control; NDD, neurodegenerative disease; PD, Parkinson's disease.

Update of

References

    1. Hamilton R. Lewy bodies in Alzheimer's disease: a neuropathological review of 145 cases using alpha‐synuclein immunohistochemistry. Brain Pathol. 2000;10:378‐384. - PMC - PubMed
    1. Twohig D, Nielsen H. α‐synuclein in the pathophysiology of Alzheimer's disease. Mol Neurodegener. 2019;14:23. - PMC - PubMed
    1. Kotzbauer P, Giasson BI, Kravitz AV, et al. Fibrillization of alpha‐synuclein and tau in familial Parkinson's disease caused by the A53T alpha‐synuclein mutation. Exp Neurol. 2004;187:279‐288. - PubMed
    1. Ishizawa T, Mattila P, Davies P, Wang D, Dickson D. Colocalization of tau and alpha‐synuclein epitopes in Lewy bodies. J Neuropathol Exp Neurol. 2003;62:389‐397. - PubMed
    1. Arima K, Mizutani T, Alim MA, et al. NACP/alpha‐synuclein and tau constitute two distinctive subsets of filaments in the same neuronal inclusions in brains from a family of parkinsonism and dementia with Lewy bodies: double‐immunolabeling fluorescence and electron microscopic studies. Acta Neuropathol. 2000;100:115‐121. - PubMed

Publication types