. 2025 May;12(20):e2411574.
doi: 10.1002/advs.202411574. Epub 2025 May 8.

Immune and Angiogenic Profiling of Mesenchymal Stem Cell Functions in a Subcutaneous Microenvironment for Allogeneic Islet Transplantation

Affiliations

Immune and Angiogenic Profiling of Mesenchymal Stem Cell Functions in a Subcutaneous Microenvironment for Allogeneic Islet Transplantation

Jocelyn Nikita Campa-Carranza et al. Adv Sci (Weinh). 2025 May.

Abstract

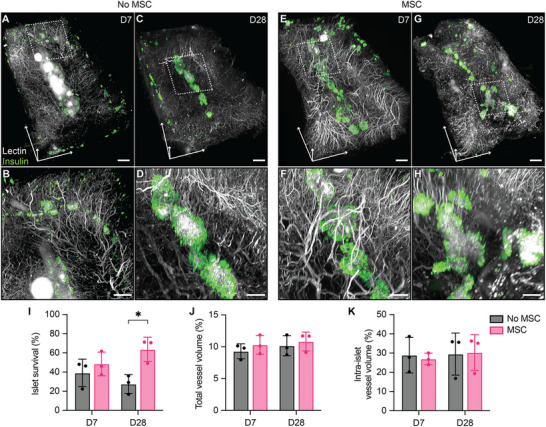
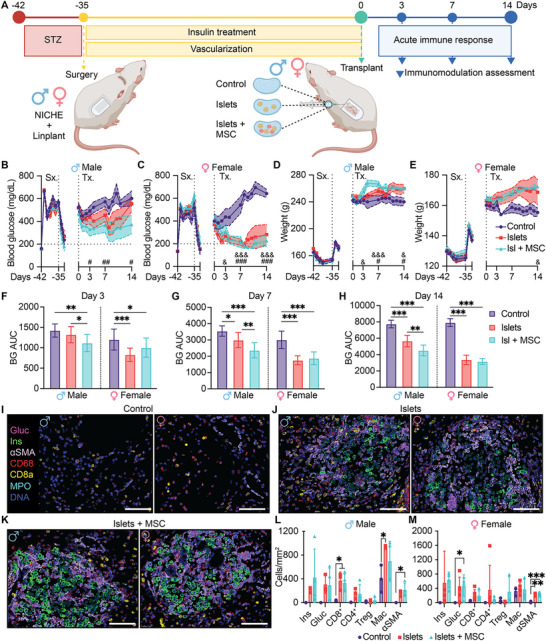
Islet transplantation offers a promising treatment for type 1 diabetes (T1D), by aiming to restore insulin production and improve glycemic control. However, T1D is compounded by impaired angiogenesis and immune dysregulation, which hinder the therapeutic potential of cell replacement strategies. To address this, this work evaluates the proangiogenic and immunomodulatory properties of mesenchymal stem cells (MSCs) to enhance vascularization and modulate early-stage immune rejection pathways in the context of islet allotransplantation. This work employs the Neovascularized Implantable Cell Homing and Encapsulation (NICHE) platform, a subcutaneous vascularized implant with localized immunomodulation developed by the group. This study assesses vascularization and immune regulation provided by MSCs, aiming to improve islet survival and integration in diabetic rats while considering sex as a biological variable. These findings demonstrate that MSCs significantly enhance vascularization and modulate the local microenvironment during the peri-transplant period. Importantly, this work discovers sex-specific differences in both processes, which influence islet engraftment and long-term function.

Keywords: Type 1 diabetes; immunomodulation; islet engraftment; mesenchymal stem cells; sex‐specific differences; vascularized subcutaneous microenvironment.


Conflict of interest statement

S.C., M.F., C.Y.X.C., and A.G. are inventors of intellectual property licensed by Continuity Biosciences. AG is a co‐founder and scientific advisor of Continuity Biosciences. The other authors declare no conflict of interest.

Figures

Figure 1
Figure 1
NICHE implant reactivity and vascularization differences between healthy and diabetic rats. A) Schematic of implanted NICHE device and B) longitudinal cross‐section of subcutaneous local microenvironment. C) Experimental design of vascularization study in Fisher (F344) rats. STZ = streptozotocin. D) BG measurements of male and female diabetic rats implanted with NICHE and Linplant (n = 25 to day 14, n = 16 to day 28, n = 8 to day 42); and healthy male rats (n = 3) for reference. Horizontal dotted line indicates glycemic control threshold. Representative Masson's trichrome staining of fibrotic capsule around NICHE implanted in E) healthy and F) diabetic male rats for 6 weeks. Scale bars, 200 µm. G) Quantification of fibrotic capsule thickness and H) implant reactivity scores of NICHE implanted in healthy (n = 4) and diabetic (n = 4) rats for 6 weeks. Mean ± SD, un‐paired Student's t‐test (*p < 0.05). Vascularized cell reservoir tissue sections stained with B. simplicifolia lectin (BS‐1) in I) healthy and J) diabetic rats. Scale bars, 50 µm. K) Area of tissue comprised by blood vessels and L) vessels quantification of NICHE implanted in healthy (n = 3) and diabetic (n = 4) rats (n = 8–10 technical replicates each). Mean ± SD of averaged technical replicates, un‐paired Student's t‐test (*p < 0.05, ***p < 0.001).
Figure 2
Figure 2
NICHE subcutaneous vascularization in diabetic rats. Representative histological images of H&E‐stained cross sections of explanted NICHE and 20× magnification of NICHE cell reservoir sections with blood vessels stained in red with BS‐1. H&E and BS‐1‐stained sections of control devices 2‐week post‐implantation for A, B) males and O, P) females. Violin plots of C, Q) area of tissue comprised by blood vessels and D, R) number of vessels inside cell reservoirs throughout 6 weeks after implantation quantified from BS‐1‐stained sections in males and females, respectively (n = 4–5 samples per condition; n = 6–10 fields of view). Violin plots show all captured fields of view, two‐way ANOVA of averaged FOV values (*p < 0.05, **p < 0.01). 2‐week post‐implantation sections of NICHE loaded with MSCs in E, F) males and S, T) females. Control devices with H&E and BS‐1 for G, H) males and U, V) females; MSC devices with H&E and BS‐1 sections for K, L) males and Y, Z) females 4 weeks post‐implantation. Control devices with H&E and BS‐1 for I, J) males and W, X) females; MSC devices with H&E and BS‐1 sections for M, N) males and AA, BB) females implanted for 6 weeks. Scale bars in H&E, 1 mm (left) and in BS‐1, 100 µm (right).
Figure 3
Figure 3
MSC induction of functional vasculature development in NICHE. Quantification of VEGF in the cell reservoir of control (n = 3–4/timepoint) and MSC‐loaded (n = 5/timepoint) NICHE devices implanted for 2, 4, and 6 weeks in A) males and B) females. Protein levels were normalized to total protein content of the tissue homogenates. Mean ± SD, two‐way ANOVA with Bonferroni's multiple comparisons test (*p < 0.05; **p < 0.01; ***p < 0.001). Representative immunofluorescent staining of NICHE vasculature in C) males and D) females at 4 weeks post‐implantation stained with functional blood vessel markers CD31 (red), eNOS (gold) and VE‐Cadherin (magenta). RBCs are autofluorescent in FITC channel (green). Scale bars, 50 µm. Fluorescence intensity analysis of E,H) CD31, F,I) eNOS, and G,J) VE‐Cad as relative expression in NICHE‐MSC compared to control devices at each timepoint for males and females (n = 4 biological replicates; n = 4 fields of view per sample). Scatter plots show mean of all captured FOV (n = 16), un‐paired Student's t‐test of averaged FOV per sample at each timepoint (*p < 0.05, **p < 0.01, ***p < 0.001), denoting level of significance compared to control hydrogel only‐NICHE.
Figure 4
Figure 4
Effect of MSCs on islet engraftment and revascularization. EZ Clear processed, wholemount lightsheet fluorescent microscopy imaged NICHE cell reservoir of islet‐loaded devices explanted at days A,B) 7 and C,D) 28; and islets + MSC‐loaded devices explanted at days E,F) 7 and G,H) 28. Islets are stained with insulin‐Alexa Flour 555 (green) and blood vessels are labeled with fluorescently conjugated Lycopersicon esculentum lectin (lectin‐DyLight 649). Scale bars; 1 mm (Top), 400 µm (bottom). I) Islet survival calculated as % of total islet volume loaded in NICHE. Blood vessel volume analysis of J) total cell reservoir and K) intra‐islet volume of no MSC (n = 3/timepoint) and MSC co‐transplanted (n = 3 /timepoint) devices. Mean ± SD, two‐way ANOVA with Bonferroni's multiple comparison (*p < 0.05).
Figure 5
Figure 5
Immunomodulatory effect of MSCs for allogeneic islet transplantation in immunocompetent and diabetic rats. A) Study design. STZ = streptozotocin, allo‐tx = allogeneic transplant. BG measurements of B) male and C) female F344 diabetic rats receiving collagen injection (control; n = 12 to day 3, n = 8 to day 7, n = 4 to day 14), islets‐only (islets), or islets co‐transplanted with MSCs (islets + MSC) in NICHE cell reservoir. (Islets, Islets + MSC; n = 14 to day 3, n = 10 to day 7, n = 5 to day 14). #: comparison of control versus islets, &: comparison of control versus islets + MSC. Horizontal dotted line indicates glycemic control threshold. Weight tracking of D) male and E) female rats. Mean ± SEM, one‐way ANOVA with Tukey's multiple comparisons test (# or & p < 0.05; ## or && p < 0.01; ### or &&& p < 0.001). Blood glucose AUC for F) day 0 to day 3 (control, n = 12; islets and islets + MSC, n = 14), for G) day 0 to day 7 (control, n = 8; islets and islets + MSC, n = 10), and for H) day 0 to day 14 (control, n = 4; islets and islets + MSC, n = 5). Mean ± SD, Two‐way ANOVA followed by Tukey's multiple comparisons test (* p < 0.05, ** p < 0.01, *** p < 0.001). IMC of cell reservoir from I) control, J) islets, and K) islets + MSC devices. Scale bars, 100 µm. Cell population quantification for L) males and M) females. (n = 3–5/group), mean ± SD, one‐way ANOVA with Tukey's multiple comparisons test per population (*p < 0.05; **p < 0.01; ***p < 0.001).
Figure 6
Figure 6
Immune characterization in NICHE local microenvironment after allogeneic islet transplant. tSNE plots of immune cells infiltrating the NICHE cell reservoir for A) males and B) females throughout 14 days post‐transplant. Heatmap of log2 fold change in immune cell populations as percent of CD45+ cells in C) males and E) females; heatmap of log2 fold change in immune cell subpopulations as percent of parent in D) males and F) females, with respect to control group. Cell population frequencies (%) shown in Figure S9, Supporting Information. Quantification of VEGF and TGFβ in the cell reservoir of NICHE devices implanted in G,H) males and I,J) females (n = 3–5 group/timepoint). Protein levels were normalized to total protein content of the tissue homogenates. Mean ± SD, two‐way ANOVA with Tukey's multiple comparisons test (*p < 0.05; **p < 0.01; ***p < 0.001). Quantification of immunomodulatory cytokines in the peri‐transplant period showing expression relative to control group in K) males and L) females. Mean ± SD, two‐way ANOVA (*p < 0.05; **p < 0.01). Concentration values (pg mL−1) shown in Figure S10, Supporting Information.
Figure 7
Figure 7
Characterization of immune response at dLN. Flow cytometry data represented as % of A,E) CD3+ and B,F) CD8+ T cells in CD45+ cells, and C,G) Treg cells in CD4+ T cells in males and females. D,H) Ratio of Treg to CD8+ T cells in males and females, respectively. (All groups, n = 4–5 per timepoint). Histogram plots of infiltrating CD11bCD11c+ DCs across 14 days post‐transplant and quantitative analysis of %DCs in CD45+ cells for I,J) males and K,L) females. Histogram plots of infiltrating CD11b+CD68+ macrophages and quantitative analysis of %macrophages in CD45+ cells for M,N) males and O,P) females. (All groups, n = 4–5 per timepoint). Mean ± SD, two‐way ANOVA with Fisher's LSD test (*p < 0.05, **p < 0.01, ***p < 0.001).
Figure 8
Figure 8
Integrative overview of the MSC‐modulated NICHE transplant microenvironment. A) Schematic workflow of Visium HD spatial transcriptomics of FFPE sections of NICHE local microenvironment after islet + MSC co‐transplant (n = 2 males, n = 2 females). B) tSNE analysis followed by principal‐component analysis (PCA) of gene expression matrixes from identified clusters (n = 41) in all samples (n = 4). C) Representative H&E‐stained image of the NICHE local microenvironment. Scale bar, 1 mm. D) Normalized gene expression (normalized by total UMI counts) of pancreatic islet markers in selected region of interest (ROI). Scale bar, 200 µm. E) Spatial plot of Visium HD clusters identified with Loupe Browser before and F) after meta‐cluster assignment. G) Spatial gene expression plot of modulatory markers related to MSCs in selected ROI. Scale bar, 200 µm. Volcano plots of differentially expressed genes highlighting upregulated genes (log2FC > 0.05 and ‐log10(p‐value) ≥ 1.5) in red for H) islet, I) islet periphery, and J) vascularized tissue meta‐clusters. Gene Ontology (GO) pathways associated with upregulated signature genes for K) islet, L) islet periphery, and M) vascularized tissue meta‐clusters. Regulated pathways identified with normalized enrichment score (NES) >1 and FDR < 0.1. RT‐PCR analysis of islet, vascular, regulatory and MSC‐related genes in NICHE cell reservoir tissues with allogeneic islets only or islets + MSC explanted at 7 days post‐transplant from N) male and O) female diabetic rats. Gene expression was normalized to Gapdh. Fold changes in gene expression are relative to islets only groups. (n = 3–6 biological replicates per group), mean ± SD, unpaired Student's t‐test (*p < 0.05) for each assayed gene. n.d. = not detected.

Similar articles

References

    1. a) Yue T., Shi Y., Luo S., Weng J., Wu Y., Zheng X., Front. Immunol. 2022, 13, 1055087; - PMC - PubMed
    2. b) Chen J., Liu Q., He J., Li Y., Front. Immunol. 2022, 13, 958790. - PMC - PubMed
    1. a) Nathan D. M., N. Engl. J. Med. 1993, 328, 1676; - PubMed
    2. b) Girard D., Vandiedonck C., Front. Cardiovasc. Med. 2022, 9, 991716. - PMC - PubMed
    1. a) Fadini G. P., Albiero M., Bonora B. M., Avogaro A., J. Clin. Endocrinol. Metab. 2019, 104, 5431; - PubMed
    2. b) Okonkwo U. A., Chen L., Ma D., Haywood V. A., Barakat M., Urao N., DiPietro L. A., PLoS One 2020, 15, 0231962. - PMC - PubMed
    1. a) Nichols J. E., La Francesca S., Niles J. A., Vega S. P., Argueta L. B., Frank L., Christiani D. C., Pyles R. B., Himes B. E., Zhang R., Li S., Sakamoto J., Rhudy J., Hendricks G., Begarani F., Liu X., Patrikeev I., Pal R., Usheva E., Vargas G., Miller A., Woodson L., Wacher A., Grimaldo M., Weaver D., Mlcak R., Cortiella J., Sci. Transl. Med. 2018, 10, aao3926; - PubMed
    2. b) Abreu S. C., Weiss D. J., Rocco P. R., Stem Cell Res. Ther. 2016, 7, 53; - PMC - PubMed
    3. c) Ionescu L., Byrne R. N., van Haaften T., Vadivel A., Alphonse R. S., Rey‐Parra G. J., Weissmann G., Hall A., Eaton F., Thebaud B., Am. J. Physiol. Lung Cell Mol. Physiol. 2012, 303, L967; - PMC - PubMed
    4. d) Lee J. W., Fang X., Krasnodembskaya A., Howard J. P., Matthay M. A., Stem Cells 2011, 29, 913; - PMC - PubMed
    5. e) Tao H., Han Z., Han Z. C., Li Z., Stem Cells Int. 2016, 2016, 1314709; - PMC - PubMed
    6. f) Thakker R., Yang P., Curr. Treat. Options Cardiovasc. Med. 2014, 16, 323; - PMC - PubMed
    7. g) Watt S. M., Gullo F., van der Garde M., Markeson D., Camicia R., Khoo C. P., Zwaginga J. J., Br. Med. Bull. 2013, 108, 25. - PMC - PubMed
    1. a) Grattoni A., Korbutt G., Tomei A. A., Garcia A. J., Pepper A. R., Stabler C., Brehm M., Papas K., Citro A., Shirwan H., Millman J. R., Melero‐Martin J., Graham M., Sefton M., Ma M., Kenyon N., Veiseh O., Desai T. A., Nostro M. C., Marinac M., Sykes M., Russ H. A., Odorico J., Tang Q., Ricordi C., Latres E., Mamrak N. E., Giraldo J., Poznansky M. C., de Vos P., Nat. Rev. Endocrinol. 2025, 21, 14; - PMC - PubMed
    2. b) Yeung T. Y., Seeberger K. L., Kin T., Adesida A., Jomha N., Shapiro A. M., Korbutt G. S., PLoS One 2012, 7, 38189; - PMC - PubMed
    3. c) Berman D. M., Willman M. A., Han D., Kleiner G., Kenyon N. M., Cabrera O., Karl J. A., Wiseman R. W., O'Connor D. H., Bartholomew A. M., Kenyon N. S., Diabetes 2010, 59, 2558; - PMC - PubMed
    4. d) Ding Y., Xu D., Feng G., Bushell A., Muschel R. J., Wood K. J., Diabetes 2009, 58, 1797; - PMC - PubMed
    5. e) Ben Nasr M., Vergani A., Avruch J., Liu L., Kefaloyianni E., D'Addio F., Tezza S., Corradi D., Bassi R., Valderrama‐Vasquez A., Usuelli V., Kim J., Azzi J., El Essawy B., Markmann J., Abdi R., Fiorina P., Acta Diabetol. 2015, 52, 917; - PMC - PubMed
    6. f) Razavi M., Wang J., Thakor A. S., Sci. Adv. 2021, 7, abf9221; - PMC - PubMed
    7. g) Vaithilingam V., Evans M. D. M., Lewy D. M., Bean P. A., Bal S., Tuch B. E., Sci. Rep. 2017, 7, 10059. - PMC - PubMed

MeSH terms

LinkOut - more resources