. 2025 Jun;17(3):e70099.
doi: 10.1111/1758-2229.70099.

Diel Bacterioplankton Community Dynamics Under Contrasting Light Regimes

Affiliations

Diel Bacterioplankton Community Dynamics Under Contrasting Light Regimes

Sofia Papadopoulou et al. Environ Microbiol Rep. 2025 Jun.

Abstract

In the Boreal region, extreme seasonal variations in day-night length expose communities to dynamic light and temperature fluctuations. Freshwater bacterioplankton, representing key ecosystem components, faces climate-driven shifts; yet the fixed day-length patterns determined by latitude underscore the importance of studying light's role in predicting ecosystem responses. We investigated bacterial community composition in a brown peat bog and a clear oligotrophic lake across seasons with contrasting light regimes: the summer solstice (> 20 h of daylight) and the autumn equinox (equal day-night length). Using amplicon sequencing of 16S rRNA transcripts, alongside measurements of physicochemical parameters, organic matter characterisation and dissolved carbon dioxide and methane gas measurements, we found no diel cycling in the lake during either period or in the peat bog near the summer solstice. However, the structure of bacterial peat bog communities exhibited cyclic changes over diel cycles at the autumn equinox. Twelve amplicon sequence variants, including both phototrophic and heterotrophic taxa, increased in abundance at all measured morning sampling times. These findings provide valuable insights into the diel patterns of boreal lentic habitats and their bacterioplankton communities, highlighting the absence of diel fluctuations in some systems and seasons, while revealing cyclic dynamics in others, driven by conditionally rare taxa.

Keywords: 16S rRNA; bacterioplankton; diel cycle; freshwater lake; methane; peat bog.


Conflict of interest statement

The authors declare no conflicts of interest.

Figures
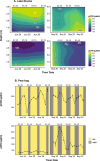
FIGURE 1
FIGURE 1
(A) Contour plots for carbon dioxide (CO2; upper plots) and methane (CH4; lower plots) partial pressure in lake Klocka in June (‘Jun’) and September (‘Sep’), across sampling time and depths. A LOESS (locally estimated scatterplot smoothing) model was fitted in the z‐axis (gas partial pressure) to generate the plots. (B) Partial pressure of CO2 (upper plots) and CH4 (lower plots) over diel cycles in the peat bog. Measurements were done in triplicates, and vertical lines indicate the standard deviation from the mean values.
FIGURE 2
FIGURE 2
Relative abundance of bacterial families in the peat bog across both sampling periods. Bars represent individual samples and each colour illustrates a different bacterial family. Taxa with relative abundances less than 1% in a sample are grouped together. ASVs with unassigned taxonomy at the family level (bootstrap less than 50) are not included in this plot, but can be found in Figure S13. The sample at time point 3 in September had zero reads and thus, no data are presented.
FIGURE 3
FIGURE 3
Relative abundance, transformed as the z‐score, for the 12 early riser ASVs that exhibited constantly their highest relative abundances at 07:15 in the peat bog during the September sampling period. The sample at time point 3 in September had zero reads and thus, no data are presented.
FIGURE 4
FIGURE 4
NMDS plot of bacterial communities in the peat bog and lake Klocka (ASV level, stress = 0.196), calculated using a Bray–Curtis dissimilarity matrix for the sampling periods in June and September. Symbols represent individual samples (189 in total), they are coloured according to the combination of site and month and shaped based on depth.
FIGURE 5
FIGURE 5
(A) NMDS plot of bacterial communities in the peat bog (ASV level, stress = 0.160), calculated using a Bray–Curtis dissimilarity matrix, for the sampling periods in June and September. Symbols represent individual samples (31 in total) and they are coloured according to sampling time and shaped based on month. Arrows represent significant (p < 0.01) correlations of environmental variables with the structure of bacterioplankton communities. The arrows length is proportional to the correlation between ordination and environmental variable. ‘T’ and ‘B’ stand for peaks T and B, respectively. ‘Temperature’ stands for water temperature, ‘HIX’ for the humification index and ‘pCH4’ for the partial pressure of methane. (B) Heat map of Kendall's Tau correlation coefficients between the early riser ASVs (rows) and the measured environmental factors (columns). The numerical scale indicates the coefficient, while the colour scale shows the degree of correlation (red for negative correlations; blue for positive correlations). Significance levels are marked with the following asterisks: *0.01 < p ≤ 0.05, **0.001 < p ≤ 0.01. ‘Oxygen’ stands for the dissolved oxygen concentration in the water, ‘Chl‐a’ for chlorophyll a, ‘FI’ for the fluorescence index, ‘β:α’ for the freshness index, ‘HIX’ for the humification index and, ‘pCH4’ and ‘pCO2’ for the partial pressure of methane and carbon dioxide, respectively.

References

    1. Amaral, V. , Graeber D., Calliari D., and Alonso C.. 2016. “Strong Linkages Between DOM Optical Properties and Main Clades of Aquatic Bacteria: Bacterioplankton Links to DOM Properties.” Limnology and Oceanography 61: 906–918. 10.1002/lno.10258. - DOI
    1. Baker, C. L. , Loros J. J., and Dunlap J. C.. 2012. “The Circadian Clock of Neurospora Crassa.” FEMS Microbiology Reviews 36: 95–110. 10.1111/j.1574-6976.2011.00288.x. - DOI - PMC - PubMed
    1. Bell‐Pedersen, D. , Cassone V. M., Earnest D. J., et al. 2005. “Circadian Rhythms From Multiple Oscillators: Lessons From Diverse Organisms.” Nature Reviews. Genetics 6: 544–556. 10.1038/nrg1633. - DOI - PMC - PubMed
    1. Bižić, M. , Klintzsch T., Ionescu D., et al. 2020. “Aquatic and Terrestrial Cyanobacteria Produce Methane.” Science Advances 6: eaax5343. 10.1126/sciadv.aax5343. - DOI - PMC - PubMed
    1. Blazewicz, S. J. , Barnard R. L., Daly R. A., and Firestone M. K.. 2013. “Evaluating rRNA as an Indicator of Microbial Activity in Environmental Communities: Limitations and Uses.” ISME Journal 7: 2061–2068. 10.1038/ismej.2013.102. - DOI - PMC - PubMed

Substances

LinkOut - more resources