

Plasmonic Molecular Entrapment for Label-Free Methylated DNA Detection and Machine-Learning Assisted Quantification
- PMID: 40344512
- PMCID: PMC12362744
- DOI: 10.1002/advs.202503257
Plasmonic Molecular Entrapment for Label-Free Methylated DNA Detection and Machine-Learning Assisted Quantification
Abstract
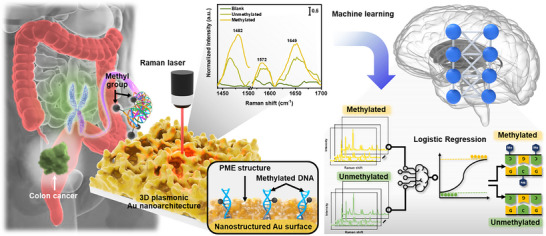
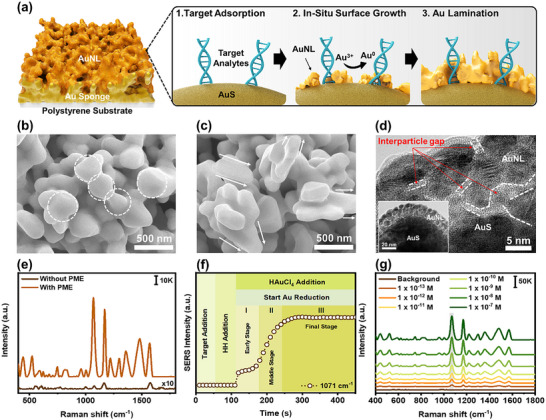
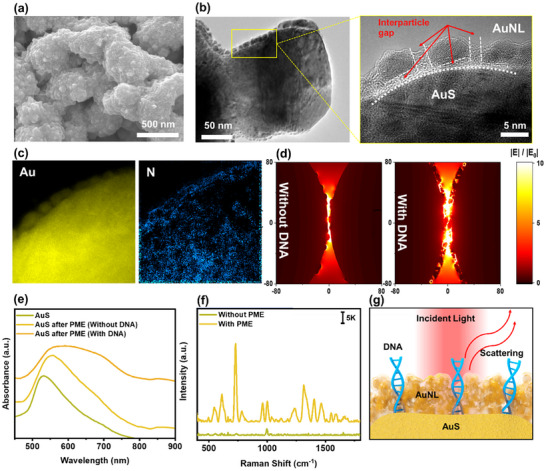
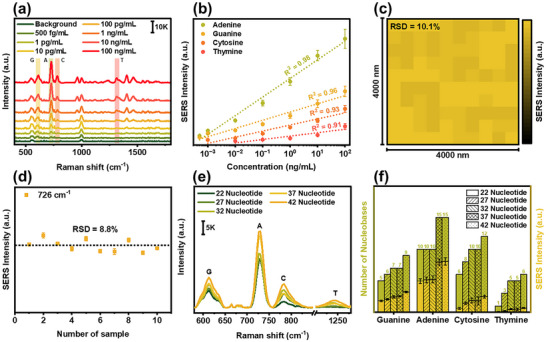
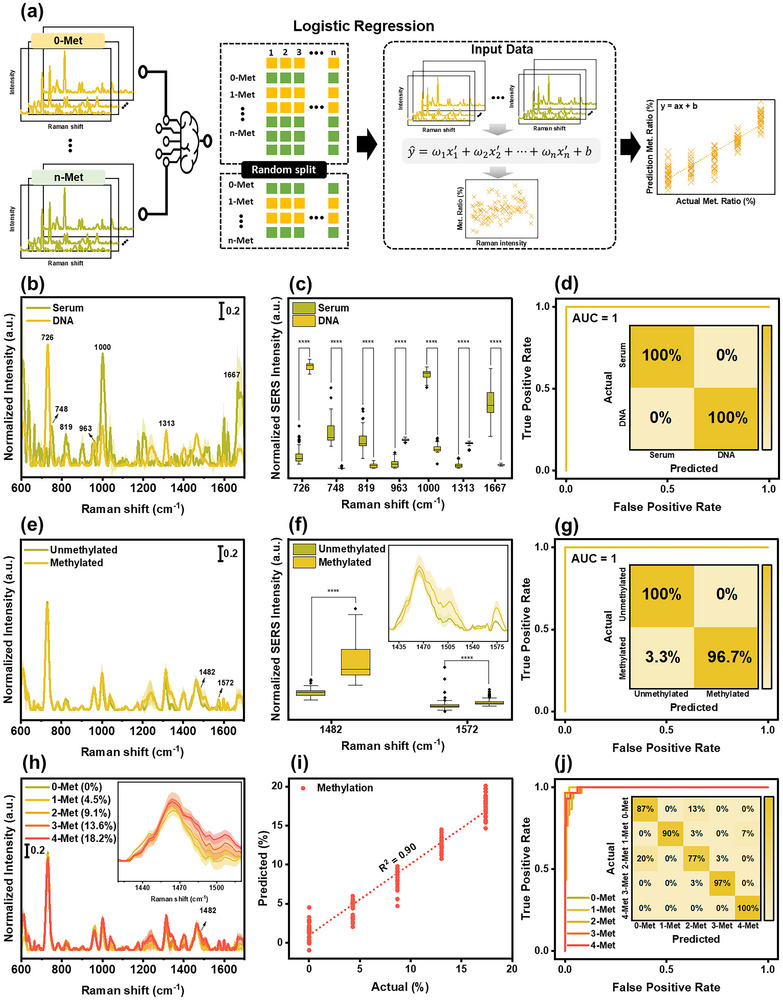
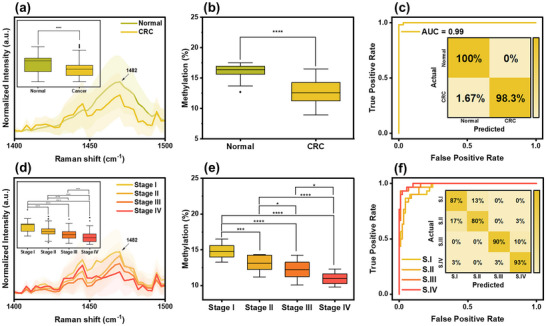
Epigenetic DNA methylations are linked to the activation of oncogenes and inactivation of tumor suppressor genes. A reliable and label-free method to quantitatively measure DNA methylation levels is essential for diagnosing and monitoring methylation-related diseases. Herein, plasmonic molecular entrapment (PME) method assisted SERS as facile strategy for trapping and label-free sensing of DNA methylation, utilizing in situ surface growth of plasmonic particle in the presence of target analytes, are developed. This highly sensitive and adaptable technique forms hotspot sites around target analytes, overcoming mismatch geometrical properties and producing a strong electromagnetic field that leads to significant SERS signal enhancement. The PME method effectively profiles and quantifies DNA methylation, demonstrating robust capabilities for DNA analysis. A logistic regression (LR)-based machine learning accurately quantifies and classifies methylation levels in clinical serum samples of colorectal cancer and normal patients with high sensitivity, specificity, and accuracy, highlighting the feasibility of this technique. The developed PME method combined with machine learning offers promising sensing techniques for disease screening and diagnosis, marking a significant advancement in disease detection and patient care.
Keywords: DNA methylation; hotspot engineering; label‐free diagnosis; plasmonic materials; surface‐enhanced Raman scattering.
© 2025 The Author(s). Advanced Science published by Wiley‐VCH GmbH.
Conflict of interest statement
The authors declare no conflict of interest.
Figures
Similar articles
-
Lung cancer diagnosis through extracellular vesicle analysis using label-free surface-enhanced Raman spectroscopy coupled with machine learning.Theranostics. 2025 Jun 23;15(15):7545-7566. doi: 10.7150/thno.110178. eCollection 2025. Theranostics. 2025. PMID: 40756369 Free PMC article.
-
Surface-Enhanced Raman Scattering Nanotags: Design Strategies, Biomedical Applications, and Integration of Machine Learning.Wiley Interdiscip Rev Nanomed Nanobiotechnol. 2025 May-Jun;17(3):e70015. doi: 10.1002/wnan.70015. Wiley Interdiscip Rev Nanomed Nanobiotechnol. 2025. PMID: 40391396 Review.
-
Recent advances in the design of SERS substrates and sensing systems for (bio)sensing applications: Systems from single cell to single molecule detection.F1000Res. 2025 Jun 24;13:670. doi: 10.12688/f1000research.149263.3. eCollection 2024. F1000Res. 2025. PMID: 40255478 Free PMC article. Review.
-
Dual-catalytic hairpin amplification strategy as a highly efficient signal amplifier cooperative with COF@Au for ultrasensitive SERS detection of miRNA-21.Anal Chim Acta. 2025 Oct 1;1369:344361. doi: 10.1016/j.aca.2025.344361. Epub 2025 Jun 23. Anal Chim Acta. 2025. PMID: 40701727
-
Circulating-tumour DNA methylation of HAND1 gene: a promising biomarker in early detection of colorectal cancer.BMC Med Genomics. 2024 Apr 30;17(1):117. doi: 10.1186/s12920-024-01893-9. BMC Med Genomics. 2024. PMID: 38689296 Free PMC article.
References
-
- Das P. M., Singal R., J. Clin. Oncol. 2004, 22, 4632. - PubMed
MeSH terms
Substances
Grants and funding
LinkOut - more resources
Full Text Sources
Medical
Research Materials
Miscellaneous