. 2025 Jun;12(23):e2500696.
doi: 10.1002/advs.202500696. Epub 2025 May 8.

An Intelligent and Conductive Hydrogel with Multiresponsive and ROS Scavenging Properties for Infection Prevention and Anti-Inflammatory Treatment Assisted by Electrical Stimulation for Diabetic Wound

Affiliations

An Intelligent and Conductive Hydrogel with Multiresponsive and ROS Scavenging Properties for Infection Prevention and Anti-Inflammatory Treatment Assisted by Electrical Stimulation for Diabetic Wound

Tao Zhang et al. Adv Sci (Weinh). 2025 Jun.

Abstract

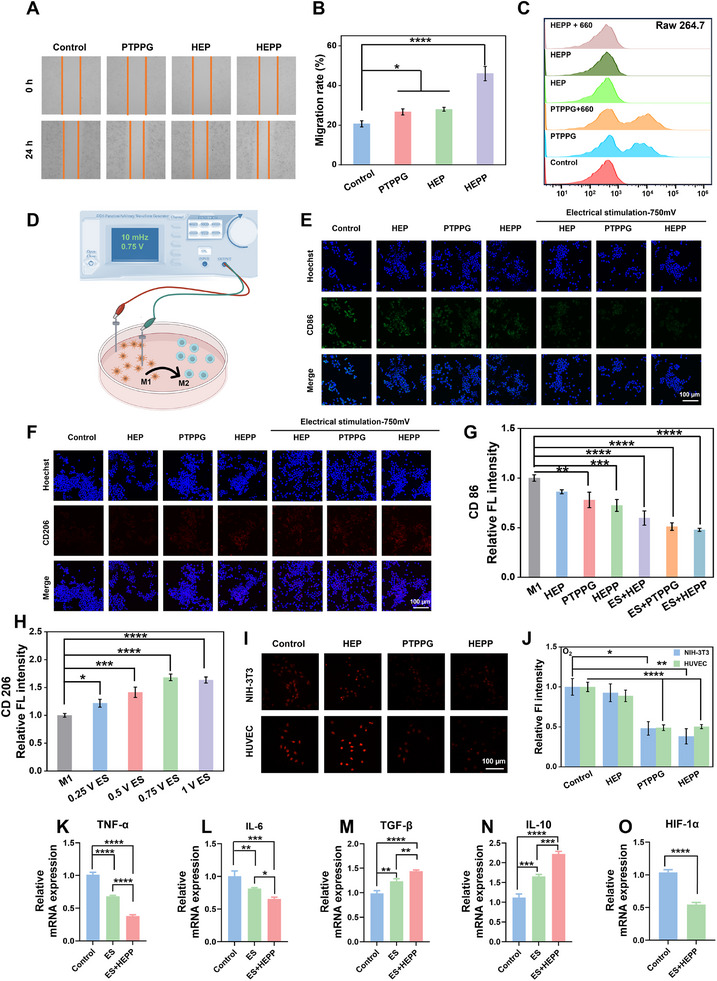
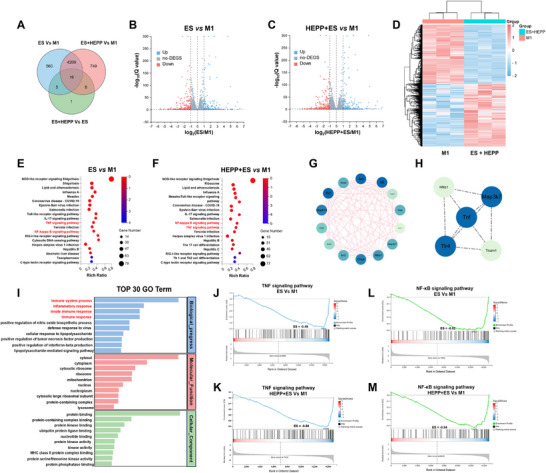
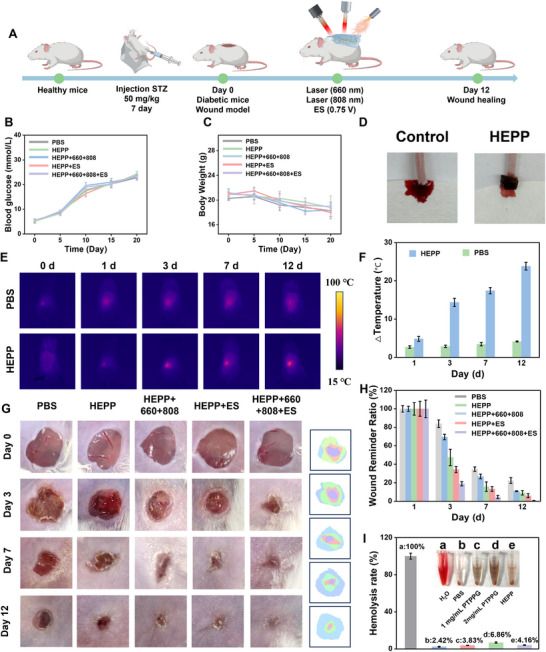
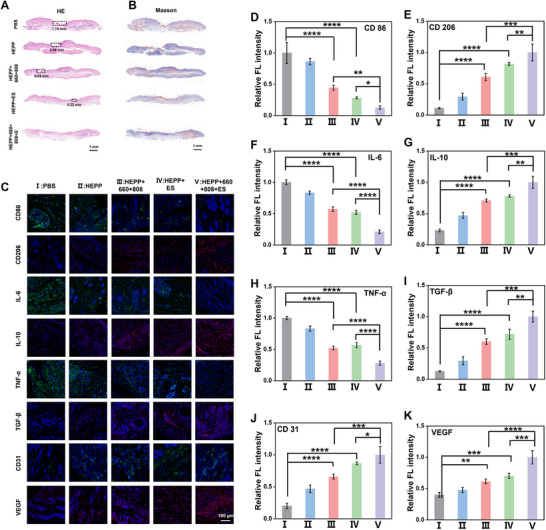
Diabetic wounds experience a hyperglycemic, hypoxic environment, combined with ongoing oxidative stress and inflammatory imbalances, significantly disrupts normal healing process. Advanced hydrogels have been considered one of the most exciting medical biomaterials for the potential in wounds healing. Herein, a novel conductive hydrogel (HEPP), designed to release nanozyme (PTPPG) in response to its microenvironment, was created to facilitate glucose (Glu) catabolism. Furthermore, the HEPP integrates photodynamic therapy (PDT), photothermal therapy (PTT), and self-cascading reactive oxygen species (ROS) to prevent bacterial infections while ensuring a continuous supply of oxygen (O2) to the wound. The HEPP not only adeptly controls high ROS levels, but also enhances the regulation of inflammation in the wound area via electrical stimulation (ES), thereby promoting healing that is supported by the immune response. Studies conducted in vitro, along with transcriptomic analyses, indicate that ES primarily mitigates inflammation by regulating Interleukin-6 (IL-6) and tumor necrosis factor-α (TNF-α). The effects of HEPP combined with ES are primarily connected to their impact on TNF signaling pathways. By reducing the formation of ROS and employing ES to effectively lessen inflammation, this approach offers an innovative method to manage complicated diabetic wounds, ulcers, and a range of inflammatory conditions linked to infections.

Keywords: ROS scavenging; antibacterial; conductive hydrogel; diabetic wound; electrical stimulation; multiple responses; synergistic anti‐inflammatory.


Conflict of interest statement

The authors declare no conflict of interest.

Figures

Scheme 1
Scheme 1
An intelligent conductive immunomodulatory hydrogel for diabetes wound healing. A) A diagram showing the fabrication process of the HEPP. Unless otherwise specified, all HEPP refer to gels with PDA@PPY doping level of 10%. B) HEPP enables responsive release intelligently, microenvironment reversal, antibacterial and inflammatory regulation. C) The immunomodulatory function of the HEPP dressing assisted by ES in the process of diabetic wound recovery.
Figure 1
Figure 1
A) The flow chart of PTPPG synthesis. B) SEM, C) TEM and D) EDS analysis of PTPPG. E) Zeta potentials of PCN‐224, PCN‐224(Ti), PTPP and PTPPG. F) XPS survey spectrum of PTPPG. G) XPS spectra of Zr 3d region, H) Ti 2p region, I) Pt 4f region, and J) Pd 3d region. K) XRD patterns of PCN‐224, PCN‐224(Ti) and PTPPG, respectively. L) Thermal gravimetric analysis profile of PTPPG.
Figure 2
Figure 2
A) The schematic description of multienzymatic activity and light responsiveness of PTPPG. B) The oxidase and peroxidase activity of PTPPG verified by coincubation of PTPPG (5 µg mL−1), H2O2 (5 mM) and TMB (5 µM) in acetate buffer solution (pH 4). Glu oxidase activity at pH of 4 (C) and 7.4 (D) evaluated using acetate buffer solution containing PTPPG and Glu in the presence of TMB/OPD, respectively. Glucose oxidase (E) and catalase activities (F) of PTPPG were verified by coincubation of PTPPG with Glu using KMnO4 (10 µg mL−1) and Ru(ddp) (250 µM), respectively. G) Continuously monitoring of oxygen generation induced by PTPPG in the presence of H2O2, Glu with or without GOx, respectively, using Ru(ddp) as the reporting agent. H) Photodynamic enhancement observed by incubating PTPPG with SOSG. I) EPR spectra of •OH, 1O2 and •O2– obtained with PTPPG incubated with H2O2, respectively. J) EPR spectra of PTPPG with or without 660 nm laser irradiation (1W, 3 min). K) Photothermal images of PTPPG at different concentrations irradiated by a laser at 808 nm with a power density of 0.9 W. Curves depicting temperature increases at varying PTPPG concentrations (L) and power densities (M) under 808 nm NIR exposure. N) The photostability evaluation of PTPPG exposed to 808 nm laser irradiation (0.9 W) for five cycles. O) The temperature variations of 100 µg mL−1 PTPPG during and after laser exposure (808 nm, 0.9 W). P) Linear approximation between −ln(θ) and time for PTPPG. Unless otherwise specified, all HEPP refer to gels with PDA@PPY doping level of 10%.
Figure 3
Figure 3
A) The flow chart of HEPP synthesis. The 1H NMR spectra of OHA‐PBA (B) and EC (C). FT‐IR spectra of OHA‐PBA (D) and EC (E). Sections (F)–(I) are SEM images of the HE and HEPP obtained at different magnification levels. Section (J) and (K) are water uptake and retention curves obtained from HEPP and HE, respectively. Release rate of PTPPG at different pH values (L), H2O2 (M) and Glu concentrations (N). O) The adhesive strength of HE and HEPP. P) Analysis of strain‐responsive rheological behavior of HE and HEPP at a frequency of 0.1 Hz, respectively. Q) Frequency‐responsive rheological characteristics of HE and HEPP under a 1% strain condition, respectively. R) Step‐strain tests conducted on GHM hydrogels at low (1%) and high (250%) strains with a set frequency of 0.1 Hz. Scavenging of DPPH (S) and ABTS (T) by HEPP. Unless otherwise specified, all HEPP refer to gels with PDA@PPY doping amount of 10%. Error bars represent the mean ± standard deviation for a sample size of 3. p values were calculated via one‐way ANOVA test. *p < 0.05, **p < 0.01, ***p < 0.001, ****p < 0.0001.
Figure 4
Figure 4
A) An illustrative diagram depicting multiple mechanisms of antibacterial activity. The OD 600 nm values of Gram‐negative bacteria and Gram‐positive bacteria treated or untreated with 660 nm (B), 808 nm (C) laser and Glu (D) for 5 min, respectively.  Fluorescent images (E) and corresponding quantitative statistical analysis (F) of the live/dead stained bacteria (SA, MRSA, PA and PDR‐PA) in PBS (pH 7.4) after treatment with different conditions. G) SEM images of bacteria subjected to different treatments using HEPP. Error bars represent the mean ± standard deviation for a sample size of 3. p values were calculated via one‐way ANOVA test. *p < 0.05, **p < 0.01, ***p < 0.001, ****p < 0.0001.
Figure 5
Figure 5
A) Scratches micrographs of HUVEC and B) corresponding quantitative histograms of HUVEC migration ratios after various treatments. C) Flow cytometric results of DCFH‐DA fluorescence in RAW264.7 cells after being treated under different conditions. D) Schematic diagram of ES treatment of macrophages to regulate inflammatory phenotype. Immunofluorescence staining of CD86 (E) and CD206 (F) expression in RAW264.7 cells under different treatment conditions. Assessment of relative fluorescence intensities of CD86 (G) and CD206 (H) in RAW264.7 cells. Fluorescence images (I) and relative fluorescence intensities (J) of dissolved O2 evaluated by Ru(dpp) using NIH‐3T3 and HUVEC cells, respectively, after being treated with different materials. (K)–(O) qRT‐PCR analysis of mRNA expressions corresponding to TNF‐α, IL‐6, TGF‐β, IL‐10, and HIF‐1α within RAW264.7 cells after different treatments, respectively. Error bars represent the mean ± standard deviation for a sample size of 3. p values were calculated via one‐way ANOVA test. *p < 0.05, **p < 0.01, ***p < 0.001, ****p < 0.0001. Unless otherwise specified, all HEPP refer to gels with PDA@PPY doping amount of 10%.
Figure 6
Figure 6
A) A Venn diagram illustrating the differential gene counts among the M1, ES, and HEPP+ES groups. Volcano plots illustrate differentially expressed genes in ES versus M1 group (B) and HEPP+ES versus M1 group (C), respectively (gray signifies nonsignificant genes; blue indicates upregulated genes; red stands for downregulated genes). D) Heatmap representation of the differentially expressed genes between M1 group and ES+HEPP group. Identification of top 20 signaling pathways using KEGG analysis in ES versus M1 (E) and HEPP+ES versus M1 group (F), respectively, enriched by genes expressed differently. PPI Networks enriched by genes expressed differently in TNF and NF‐κB1 signaling pathways, contrasting ES group versus M1 group (G) and HEPP+ES group versus M1 group (H). I) GO enrichment analysis showing top 30 pathways involved. (J)–(M) GSEA analysis highlighting two key inflammatory pathways: TNF and NF‐κB. Unless otherwise specified, all HEPP refer to gels with PDA@PPY doping amount of 10%.
Figure 7
Figure 7
A) Diagram illustrating the creation of a mouse model for diabetic wound management. The blood Glu level (B) and body weight level (C) during the modeling and treatment process. D) The hemostatic properties of HEPP. E) Responsive photothermal imaging of the release of PTPPG during HEPP treatment. F) The temperature changes of the wound treated with and without HEPP. G) The images illustrating the progression of diabetic wound in mice that received different treatments. H) Changes in relative wound area in different groups. I) Hemolysis experiments of different materials.
Figure 8
Figure 8
Histopathological examination using H&E staining (A) and Masson staining (B). C) Analysis of immunofluorescence for CD86, CD206, IL‐6, IL‐10, TNF‐α, TGF‐β, CD31, and VEGF in tissue sections obtained from the diabet wound site. D–K) Quantitative analysis of mean fluorescence intensities of CD86, CD206, IL‐6, IL‐10, TNF‐α, TGF‐β, CD31 and VEGF after various treatments (I–V represent PBS, HEPP, HEPP + 660 + 808, HEPP + ES, HEPP + 660 + 808 + ES treatment groups, respectively). Error bars represent the mean ± standard deviation for a sample size of 3. p values were calculated via one‐way ANOVA test. *p < 0.05, **p < 0.01, ***p < 0.001, ****p < 0.0001. Unless otherwise specified, all HEPP refer to gels with PDA@PPY doping amount of 10%.

Similar articles

Cited by

References

    1. a) Shang L., Yu Y., Jiang Y., Liu X., Sui N., Yang D., Zhu Z., ACS Nano 2023, 17, 15962; - PubMed
    2. b) Romero‐Gómez M., Zelber‐Sagi S., Martín F., Bugianesi E., Soria B., BMJ 2023, 383, 075179. - PMC - PubMed
    1. a) Dhyani A., Repetto T., Bartikofsky D., Mirabelli C., Gao Z., Snyder S. A., Snyder C., Mehta G., Wobus C. E., VanEpps J. S., Tuteja A., Matter 2022, 5, 4076; - PMC - PubMed
    2. b) Wei T., Pan T., Peng X., Nat. Nanotechnol. 2024, 19, 1178. - PubMed
    1. a) Xiang P., Jiang M., Chen X., Chen L., Cheng Y., Luo X., Zhou H., Zheng Y., Adv. Sci. 2024, 11, 2305856; - PMC - PubMed
    2. b) Deng Z., Zhang M., Nat. Nanotechnol. 2024, 19, 1083. - PubMed
    1. a) Guan Y., Niu H., Liu Z., Dang Y., Shen J., Zayed M., Ma L., J. Guan, Sci. Adv. 2021, 7, abj0153; - PMC - PubMed
    2. b) Qi X., Ge X., Chen X., Cai E., Xiang Y., Xu H., Li Y., Lan Y., Shi Y., Deng H., Shen J., Adv. Funct. Mater. 2024, 34, 2400489.
    1. a) Falanga V., Lancet 2005, 366, 1736; - PubMed
    2. b) Guo Y., Ding S., Shang C., Zhang C., Li M., Zhang Q., Gu L., Heng B. C., Zhang S., Mei F., Huang Y., Zhang X., Xu M., Jiang J., Guo S., Deng X., Chen L., Adv. Mater. 2024, 36, 2306292. - PubMed

LinkOut - more resources