. 2025 May;12(20):e2403801.
doi: 10.1002/advs.202403801. Epub 2025 May 9.

Disentangling the Switching Behavior in Functional Connectivity Dynamics in Autism Spectrum Disorder: Insights from Developmental Cohort Analysis and Molecular-Cellular Associations

Affiliations

Disentangling the Switching Behavior in Functional Connectivity Dynamics in Autism Spectrum Disorder: Insights from Developmental Cohort Analysis and Molecular-Cellular Associations

Wei Li et al. Adv Sci (Weinh). 2025 May.

Abstract

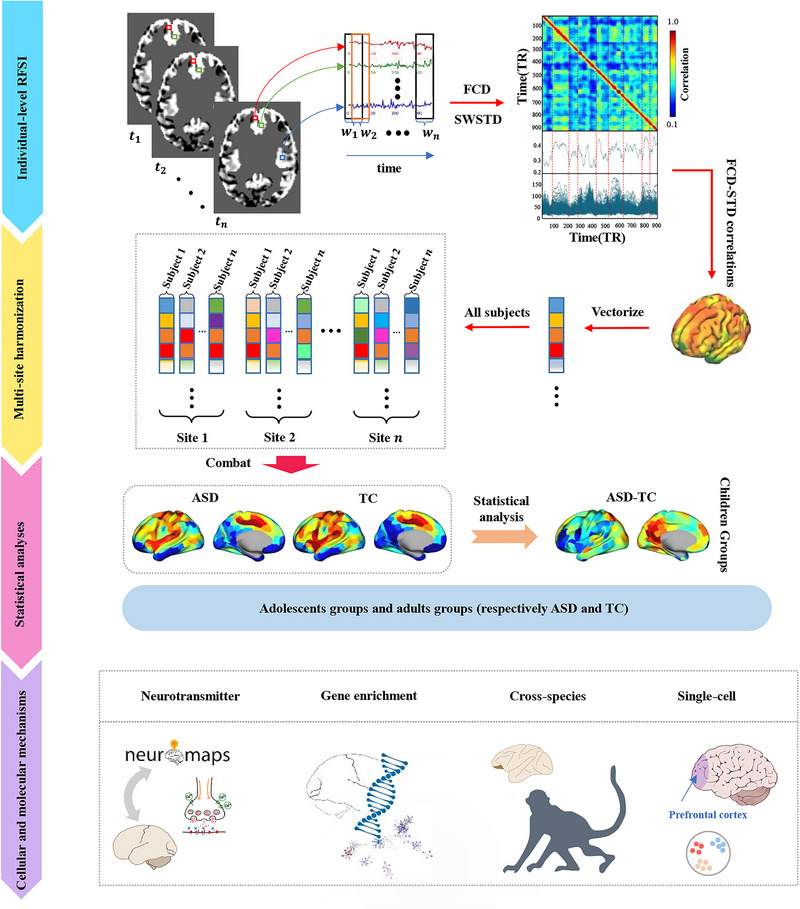
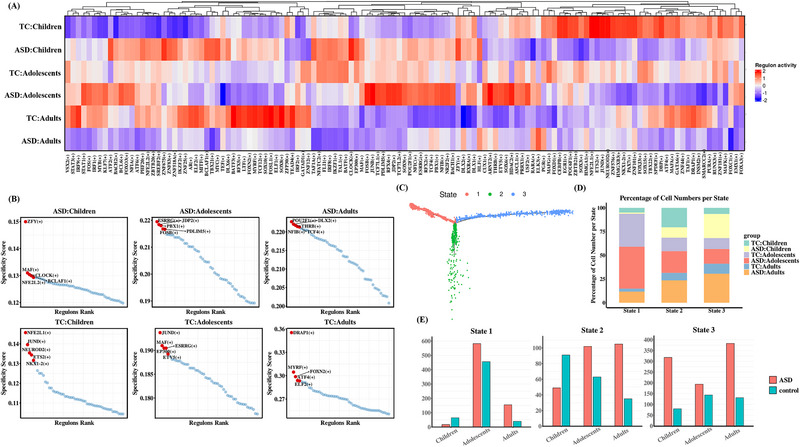
Characterizing the transition or switching behavior between multistable brain states in functional connectivity dynamics (FCD) holds promise for uncovering the underlying neuropathology of Autism Spectrum Disorder (ASD). However, whether and how switching behaviors in FCD change in patients with developmental ASD, as well as their cellular and molecular basis, remains unexplored. This study develops a region-wise FCD switching index (RFSI) to investigate the drivers of FCD. This work finds that brain regions within the salience, default mode, and frontoparietal networks serve as abnormal drivers of FCD in ASD across different developmental stages. Additionally, changes in RFSI at different developmental stages of ASD correlated with transcriptomic profiles and neurotransmitter density maps. Importantly, the abnormal RFSI identifies in humans has also been observed in genetically edited ASD monkeys. Finally, single-nucleus RNA sequencing data from patients with developmental ASD are analyzed and aberrant switching behaviors in FCD may be mediated by somatostatin-expressing interneurons and altered differentiation patterns in astrocyte State2. In conclusion, this study provides the first evidence of abnormal drivers of FCD across different stages of ASD and their associated cellular and molecular mechanisms. These findings deepen the understanding of ASD neuropathology and offer valuable insights into treatment strategies.

Keywords: autism spectrum disorder; brain dynamics; development; molecular mechanisms; resting‐state fMRI.


Conflict of interest statement

The authors declare no conflict of interest.

Figures

Figure 1
Figure 1
Overview of the method pipeline. First, calculation of RFSI at the individual level. Second, harmonization of multi‐site data. Third, categorization of subjects into children, adolescents, and adults based on age and into ASD and typical control TC groups based on disease status. Finally, exploring the cellular and molecular mechanisms underlying aberrant switching behaviors. Partial brain map from https://scidraw.io/.[ 40 , 41 , 42 , 43 , 44 ]
Figure 2
Figure 2
MANOVA revealed the abnormal RFSI. A) The Age and Group effects mapping to the cerebral cortex, where Age and Group effects were FDR‐corrected p < 0.05 corrected to obtain mapping maps with thresholds. The red areas of the centermost map indicate brain regions where Age and Group effects overlap after FDR correction (children: 253 ASD and 345 TC; adolescents: 274 ASD and 283 TC; adults: 293 ASD and 252 TC; MANOVA). B) Functional connectivity dynamic deficits associated with clinical symptoms, illustrating differences in RFSI in the brains of ASD with severe (above mean) and mild (below mean) conditions (unpaired two‐sample t‐tests). Each row of the matrix heat map represents the ASD behavioral scale, each column represents the age versus group FDR corrected p < 0.05 surviving brain regions, and * indicates the significant differences between severely and mildly affected patients in a region (FDR corrected p < 0.05). C) Developmental trajectories of brain dynamics. Changes in children, adolescents, and adults were calculated based on the Yeo 7 network partitioned into Group effect threshold map. Line graphs depict the trend of the mean z‐values of ASD and TC across the three networks. * Indicates a significant difference in unpaired two‐sample t‐tests (Bonferroni corrected p < 0.05), while NS indicates no significant difference. Error bar, 95% confidence intervals for mean.
Figure 3
Figure 3
Interpretation of abnormal RFSI A) Decoding of Group effect in Brain Function. Relationships between Group effect F‐map and 24 cognitive components based on the NeuroSynth meta‐analysis database. Each row indicates that the components were sorted from left to right by five percent increments of the F‐statistic and each column indicates that cognitive components were sorted by the weighted average of the resulting z‐statistic values. B) Spatial correlation analysis of ASD brain variability with neurotransmitter receptor density maps. Spin‐test was used to test for significance and the spatial correlation was interpreted by rotating the Group effect F‐map 10 000 times.
Figure 4
Figure 4
Similarity analysis of brain RFSI differences between ASD macaques and adults with ASD. A) The RFSI for ASD monkey models (ASD) and wild type (WT) monkeys at the group level, as well as spatial t‐map of ASD‐WT differences are shown (unpaired two‐sample t‐tests). B) Comparison of similar regions in the pattern of differences between ASD‐WT in monkeys and ASD‐TC in adults.
Figure 5
Figure 5
From macro‐cortical abnormal dynamics to cell type‐specific gene expression. A) Differences in the left dorsolateral prefrontal RFSI between the ASD and TC groups in children, adolescents, and adults (unpaired two‐sample t‐tests). B) Clustering of snRNA‐seq data using the SSN algorithm and cell types were annotated according to the expression of known marker genes. Key annotations: OPC, Oligodendrocyte precursor cells; Oligo, Oligodendrocytes; AST‐PP, Protoplasmic astrocytes; AST‐FB, Fibrous astrocytes; Microglia, Microglia cell; End, Endothelial; Neu‐NRGN, NRGN‐expressing neurons; Nue‐mat; Maturing neurons; IN‐SST, Somatostatin interneurons; IN‐SV2C, SV2C interneurons; IN‐VIP, VIP interneurons; IN‐PVALB, Parvalbumin interneuron; IN‐RELN, Reelin interneuron; L2/3, Layer 2/3 excitatory neurons; L4, Layer 4 excitatory neurons; and L5/6, Layer 5/6 projection neurons. C) Dot plots showing the expression levels of specific marker genes for each cell type with a color gradient from dark green to light green indicating high to low levels of gene expression. The dot size indicates the percentage of cells in the cluster that express the gene. D) Volcano plots of differentially expressed cell type‐specific genes in the children, adolescents, and adults, with each volcano showing the top five differentially expressed genes. E) Venn diagram indicating the number of differential genes in the child, adolescent, and adult groups (Wilcoxon rank sum test, Bonferroni p < 0.05).
Figure 6
Figure 6
Differential gene enrichment analysis. A) Upregulated DEGs per clusters. B) Downregulated DEGs per cluster. C) Displaying the average expression of specific gene sets within the transects across cell types. D) GO enrichment of overlapping DEGs across age groups. E) GO enrichment of upregulated and downregulated DEGs across age groups. The colors of the circles represent different classifications and the size of the circle represents the number of genes in the corresponding entries.
Figure 7
Figure 7
Single‐cell transcription factor analysis and trajectory analysis. A) Heatmap of RAS activity of cell‐level regulons in each group with each column indicating a different regulon and each row indicating a different grouping. The color from blue to red indicates the RAS activity score from low to high. The higher the score of RAS, the stronger the activity of regulon in that group. B) Ranking of RSS scores for each group and labeling of the top five regulon. Regulators with higher RSS may be associated with this age stage specificity. C) Differentiation trajectories of astrocytes. D) Percentage distribution of cell numbers in each age group for the three states. E) Distribution of cell numbers for the three states in each age group in the ASD and TC groups.

Similar articles

References

    1. Friston K. J., Brain Connect. 2011, 1, 13. - PubMed
    1. Betzel R. F., Network Neurosci. 2020, 4, 234. - PMC - PubMed
    1. Gozzi A., Schwarz A. J., NeuroImage 2016, 127, 496. - PubMed
    1. Ma Y., Shaik M. A., Kozberg M. G., Kim S. H., Portes J. P., Timerman D., Hillman E. M. C., Proc. Natl. Acad. Sci. U.S.A. 2016, 113, E8463. - PMC - PubMed
    1. Hutchison R. M., Womelsdorf T., Gati J. S., Everling S., Menon R. S., Hum. Brain Mapp. 2013, 34, 2154. - PMC - PubMed