. 2025 Aug;292(15):4018-4038.
doi: 10.1111/febs.70118. Epub 2025 May 9.

STIM2β is a Ca2+ signaling modulator for the regulation of mitotic clonal expansion and PPARG2 transcription in adipogenesis

Affiliations

STIM2β is a Ca2+ signaling modulator for the regulation of mitotic clonal expansion and PPARG2 transcription in adipogenesis

Su Ji Jeong et al. FEBS J. 2025 Aug.

Abstract

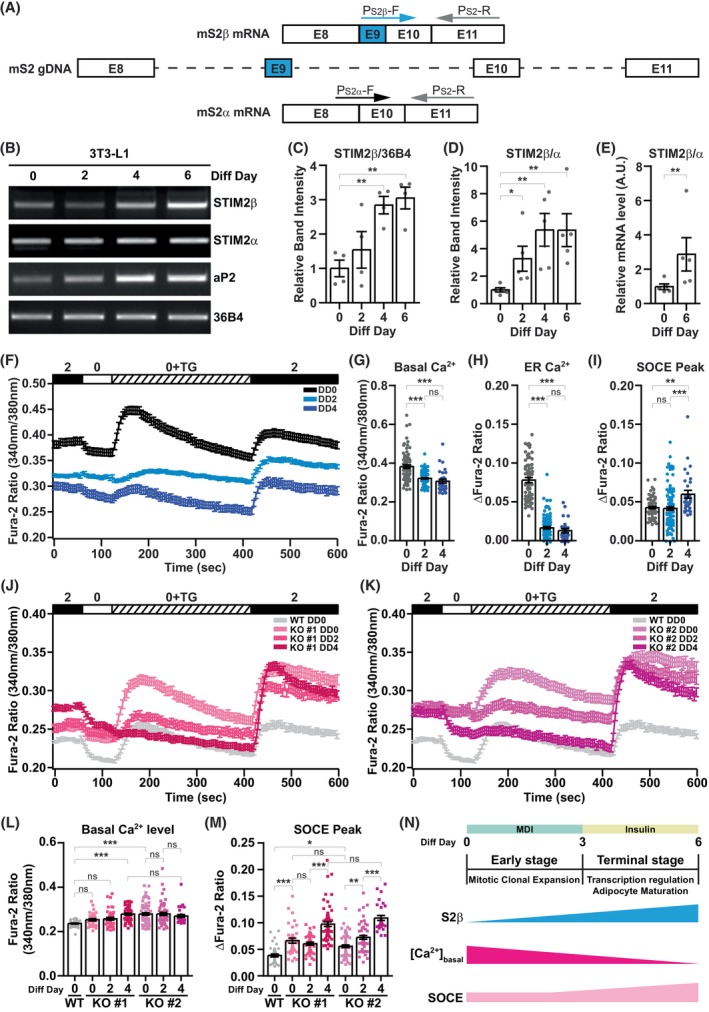
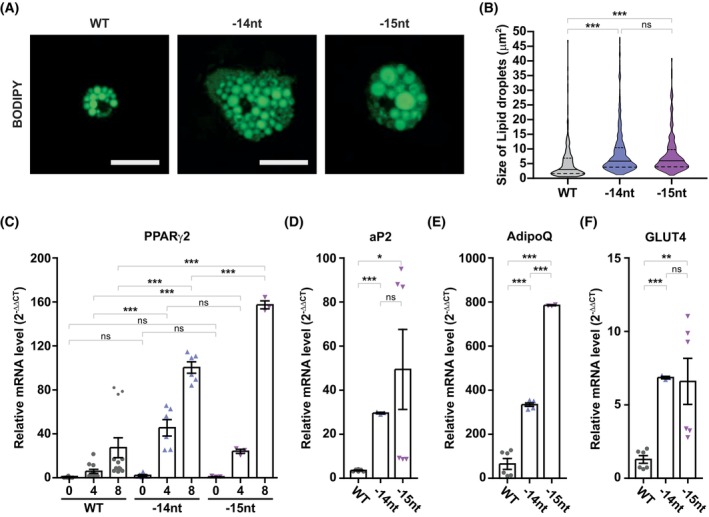
Intracellular Ca2+ is crucial in the regulation of adipocyte lipid metabolism and adipogenesis. In this study, we aimed to investigate the regulation mechanism of intracellular Ca2+ levels ([Ca2+]i) during adipocyte differentiation. We found that the expression of stromal interaction molecule 2 beta (STIM2β), which is the inhibitor of store-operated Ca2+ entry (SOCE), is upregulated throughout the differentiation process. Evaluation of [Ca2+]i in 3 T3-L1 and primary stromal vascular fraction (SVF) cells revealed that the basal Ca2+ level is downregulated after differentiation. Knockout (KO) of STIM2β in 3T3-L1 and primary SVF cells showed increased [Ca2+]i, indicating the involvement of STIM2β in the regulation of [Ca2+]i during adipogenesis. We further evaluated the function of STIM2β-mediated [Ca2+]i in early and terminal differentiation of adipogenesis. Analysis of cell proliferation rate during mitotic clonal expansion (MCE) in wild-type and STIM2β KO 3T3-L1 cell lines revealed that a larger population of KO cells underwent G1 arrest, suggesting that reduced [Ca2+]i by STIM2β induces MCE. Additionally, ablation of STIM2β increased differentiation efficiency, with more lipid accumulation and rapid transcriptional activation of adipogenic genes, especially proliferator-activator receptor γ2 (PPARG2). We found that PPARG2 transcription is regulated by store-operated calcium entry (SOCE) downstream transcription factors, confirming that increased [Ca2+]i by STIM2β ablation promotes PPARG2 transcription during adipogenesis. Additionally, STIM2β KO mice showed hypertrophic adipose tissue development. Our data suggest that STIM2β-mediated [Ca2+]i plays a pivotal role in the regulation of mitotic clonal expansion and PPARG2 gene activation and provides evidence that MCE is not a prerequisite process for terminal differentiation during adipogenesis.

Keywords: PPARγ2; STIM2β; adipogenesis; cell cycle regulation; intracellular Ca2+.


Conflict of interest statement

The authors declare no conflict of interest.

Figures

Fig. 1
Fig. 1
STIM2β is upregulated and decreases intracellular Ca2+ levels ([Ca2+]i) during differentiation of 3T3‐L1 pre‐adipocytes. (A) Schematic description of PCR primers specific for STIM2α and STIM2β. (B) Reverse transcription polymerase chain reaction (RT‐PCR) analysis of the mRNA expression of STIM2 alternative splicing variants in 3T3‐L1 cells at the indicated differentiation day (Diff Day). This experiment was repeated more than 5 times using independent sets of differentiated samples. (C) Bar graphs represent the RT‐PCR band intensity of STIM2β relative to 36B4; 4 independent gel images were used to analyze the band intensity of STIM2β. (D) Relative expression level of STIM2β mRNA relative to STIM2α in 3T3‐L1 cells. 5 different gel images were used to analyze the expression of STIM2β mRNA levels. An unpaired t‐test was used for the statistical evaluation of (C) and (D). (E) Quantitative real‐time polymerase chain reaction (qPCR) analysis of relative expression levels of STIM2 alternative splicing variants in 3T3‐L1 cells. 5 different sets of cDNA samples were used for the analysis. An unpaired t‐test was used to evaluate the statistical significance. (F) [Ca2+]i analysis in undifferentiated (Differentiation Day 0; DD0) and differentiated (Differentiation Day 2; DD2 and Differentiation Day 4; DD4) 3T3‐L1 cells. [Ca2+]i were expressed as ratios of 340:380 nm Fura‐2 fluorescence signals. (DD0, n = 77; DD2, n = 116; DD4, n = 30). (G) Bar graph presents the basal Ca2+ levels of cells in (F). Basal Ca2+ level was calculated by averaging Fura‐2 ratios of 340:380 nm fluorescence signals from 30 to 60 s. The one‐way ANOVA test combined with Bonferroni's Multiple Comparison Test was used to evaluate statistical significance. (H) Bar graph presents the ER Ca2+ release by thapsigargin (TG) treatment in (F). The ER Ca2+ release was calculated by subtracting the minimum Fura‐2 ratio from the maximum Fura‐2 ratio. These ratios were obtained by averaging the values from three imaging points preceding and following the respective maximum and minimum points. The one‐way ANOVA test combined with Bonferroni's Multiple Comparison Test was used to evaluate statistical significance. (I) Bar graph presents the store‐operated Ca2+ entry (SOCE) peak after 2 mm Ca2+ add‐back in (F). SOCE peak was calculated by subtracting the minimum Fura‐2 ratio from the maximum Fura‐2 ratio. These ratios were obtained by averaging the values from three imaging points preceding and following the respective maximum and minimum points. The one‐way ANOVA test combined with Bonferroni's Multiple Comparison Test was used to evaluate statistical significance. The data presented in (F–I) is representative, and the [Ca2+]i analysis experiment was repeated more than 5 times. (J) [Ca2+]i analysis in STIM2β knockout(KO) #1 3T3‐L1 cell line at differentiation day 0, 2, and 4 (presented as DD0, DD2, and DD4). Wild‐type (WT) 3T3‐L1 cells at differentiation day 0 (presented as WT DD0) were used as control (WT DD0, n = 39; KO #1 DD0, n = 35; KO #1 DD2, n = 40; KO #1 DD4, n = 59). (K) [Ca2+]i analysis in STIM2β KO #2 3T3‐L1 cell line at differentiation day 0, 2, and 4 (presented as DD0, DD2, and DD4). WT 3T3‐L1 cells at differentiation day 0 (WT DD0) were used as control (WT DD0, n = 39; KO #1 DD0, n = 68; KO #1 DD2, n = 54; KO #1 DD4, n = 30). (L) Bar graph presents the basal Ca2+ levels of cells in (J) and (K). Basal Ca2+ level was calculated by averaging Fura‐2 ratios of 340:380 nm fluorescence signals from 30 to 60 s. The one‐way ANOVA test combined with Bonferroni's Multiple Comparison Test was used to evaluate statistical significance. (M) Bar graph presents the SOCE peak after 2 mm Ca2+ add‐back in (J) and (K). SOCE peak was calculated by subtracting the minimum Fura‐2 ratio from the maximum Fura‐2 ratio. These ratios were obtained by averaging the values from three imaging points preceding and following the respective maximum and minimum points. The one‐way ANOVA test combined with Bonferroni's Multiple Comparison Test was used to evaluate statistical significance. The data presented in (J–M) is representative, and the [Ca2+]i analysis experiment was repeated more than 5 times. (N) Schematic description of changes in STIM2β expression levels and [Ca2+]i during adipogenesis; Bars represent mean ± SEM. Levels of significance are as follows: ns, not significant; *P < 0.05; **P < 0.01; ***, P < 0.001.
Fig. 2
Fig. 2
STIM2β is upregulated and decreases intracellular Ca2+ levels ([Ca2+]i) during the differentiation of primary stromal vascular fraction (SVF) cells. (A) mRNA expression analysis of STIM2 alternative splicing variants in primary SVF cells by RT‐PCR. This data is representative, and the experiment was repeated a total of 3 times. (B) Bar graphs represent the relative expression levels of STIM2β over STIM2α analyzed by qPCR. This data represents the combined results from 3 distinct cDNA sets, each analyzed in triplicate. Unpaired t‐test was used for the statistical evaluation. (C) [Ca2+]i analysis of wild‐type (WT) SVF cells at differentiation day 0 (DD0) and differentiation day 2 (DD2). [Ca2+]i were expressed as ratios of 340 : 380 nm Fura‐2 fluorescence signals. (DD0, n = 14; DD2, n = 29). (D) Bar graph presents the basal Ca2+ levels of cells in (C). Basal Ca2+ level was calculated by averaging Fura‐2 ratios of 340:380 nm fluorescence signals from 30 to 60 s; Unpaired t‐test was used for the statistical evaluation. (E) Bar graph presents the endoplasmic reticulum (ER) Ca2+ release by thapsigargin (TG) treatment in (C). The ER Ca2+ release was calculated by subtracting the minimum Fura‐2 ratio from the maximum Fura‐2 ratio. These ratios were obtained by averaging the values from three imaging points preceding and following the respective maximum and minimum points. Unpaired t‐test was used for the statistical evaluation. (F) Bar graph presents the store‐operated Ca2+ entry (SOCE) peak after 2 mm Ca2+ add‐back in (F). SOCE peak was calculated by subtracting the minimum Fura‐2 ratio from the maximum Fura‐2 ratio. These ratios were obtained by averaging the values from three imaging points preceding and following the respective maximum and minimum points; Unpaired t‐test was used for the statistical evaluation. The data presented in (C–F) is representative, and the experiment was repeated 3 times. (G) Sequence information of STIM2β exon 9 region of WT and STIM2β knockout (KO) mice. (H) mRNA expression of STIM2α and STIM2β in WT and STIM2β KO primary SVF cells after differentiation using RT‐PCR. This data is representative, and the experiment was repeated more than 5 times using independent sets of samples. (I) [Ca2+]i analysis of WT and STIM2β KO SVF cells at differentiation day 0 (DD0). [Ca2+]i were expressed as ratios of 340:380 nm Fura‐2 fluorescence signals. (WT, n = 43; −14 nt, n = 22; −15 nt, n = 25). (J) [Ca2+]i analysis of WT and STIM2β KO SVF cells at differentiation day 2 (DD2). [Ca2+]i were expressed as ratios of 340:380 nm Fura‐2 fluorescence signals. (WT, n = 62; −14 nt, n = 28; −15 nt, n = 30). (K) Bar graph presents the basal Ca2+ levels of cells in (I) and (J). Basal Ca2+ level was calculated by averaging Fura‐2 ratios of 340:380 nm fluorescence signals from 30 to 60 s. The one‐way ANOVA test combined with Bonferroni's Multiple Comparison Test was used to evaluate statistical significance. (L) Bar graph presents the ER Ca2+ release by TG treatment in (I) and (J). The ER Ca2+ release was calculated by subtracting the minimum Fura‐2 ratio from the maximum Fura‐2 ratio. These ratios were obtained by averaging the values from three imaging points preceding and following the respective maximum and minimum points. The one‐way ANOVA test combined with Bonferroni's Multiple Comparison Test was used to evaluate statistical significance. (M) Bar graph presents the SOCE peak after 2 mm Ca2+ add‐back in (I) and (J). SOCE peak was calculated by subtracting the minimum Fura‐2 ratio from the maximum Fura‐2 ratio. These ratios were obtained by averaging the values from three imaging points preceding and following the respective maximum and minimum points. The one‐way ANOVA test combined with Bonferroni's Multiple Comparison Test was used to evaluate statistical significance. The data presented in (I–M) is representative, and the experiment was repeated 3 times. Bars represent mean ± SEM. Levels of significance are as follows: ns, not significant; *, P < 0.05; **, P < 0.01; ***, P < 0.001.
Fig. 3
Fig. 3
STIM2β‐mediated Mitotic Clonal Expansion (MCE) regulation during the early stage of adipogenesis. (A) Schematic description of proliferation status of 3T3‐L1 cells during adipogenesis. (B, C) Cell cycle analysis of 3T3‐L1 cells during adipogenesis. Comparison of increase in cell number between wild‐type (WT) and STIM2β knockout (KO) 3T3‐L1 cell lines in the growth medium (B) and differentiation medium (C). The cell number ratio was calculated at a given time point divided by the initial cell number of WT 3T3‐L1 cells. This data represents the combined results from 3 repeated experiments. (D) Comparison of growth rate before and after differentiation induction in WT and STIM2β KO 3T3‐L1 cell lines. The growth rate was calculated using cell numbers from (B) and (C). (E) Flow cytometric cell cycle analysis of WT and STIM2β KO 3T3‐L1 cell lines by PI staining. This data is representative, and the experiment was repeated 3 times. (F) The graph represents the percentage of the cells in each phase of the cell cycle at differentiation day 2. This data represents the combined results from 3 repeated flow cytometric cell cycle analyses using PI staining. Statistical significances are as follows: G0/G1 phase, WT vs KO #1: ***, WT vs KO #2: ***, KO #1 vs KO #2: ns; M/G2 phase, WT vs KO #1: **, WT vs KO #2: **, KO #1 vs KO #2: ns; S phase, WT vs KO #1: ns, WT vs KO #2: ns, KO #1 vs KO #2: ns; Two‐way ANOVA test combined with Bonferroni correction was used to evaluate the statistical significance. Levels of significance are as follows: ns, not significant; *, P < 0.05; **, P < 0.01; ***, P < 0.001.
Fig. 4
Fig. 4
STIM2β deficiency enhances adipogenesis of 3T3‐L1 pre‐adipocytes. (A) Analysis of lipid accumulation in wild‐type (WT) 3T3‐L1 cells after treatment of store‐operated Ca2+ entry (SOCE) inhibitors. Cells were treated with 1 μm Gd3+, 1 μm YM58483, and 50 μm 2‐APB for 5 days with the differentiation medium. Differentiation medium‐only treated condition was used as a control to normalize the total amount of lipid quantified by Oil Red O staining. One‐way ANOVA test combined with Dunnett's Multiple Comparison test was used to evaluate statistical significance. This data is the combined results from 3 distinct sets of experiments. (B) Lipid accumulation and morphological change analysis by Oil Red O staining at the indicated time after hormonal differentiation induction of WT and STIM2β knockout (KO) 3T3‐L1 cell lines. Scale bars represent 100 μm; this data is representative, and the experiment was repeated 3 times. (C) Total lipid amount of (B) was analyzed by measuring the absorbance of Oil Red O at different time points of differentiation. The absorbance value of each time point was normalized by that on day 3 for each cell line. This data is the combined result from 3 distinct sets of experiments. A two‐way ANOVA test with Bonferroni correction was used to evaluate statistical significance. (D) Expression levels of adipogenic marker genes peroxisome proliferator‐activated receptor gamma 2 (PPARγ2), fatty acid binding protein 4 (aP2), and adiponectin (AdipoQ) were analyzed by qPCR to compare the efficiency of adipogenesis between WT and STIM2β KO 3T3‐L1 cell lines. This data represents triplicated results, and the experiment was repeated more than 3 times. A two‐way ANOVA test with Bonferroni correction was used to evaluate statistical significance. (E) Schematic description of the effect of STIM2β KO on intracellular Ca2+ levels and the terminal differentiation. Bars represent mean ± SEM. Levels of significance are as follows: **, P < 0.01; ***, P < 0.001.
Fig. 5
Fig. 5
Increased peroxisome proliferator‐activated receptor gamma 2 (PPARγ2) transcription and activity in STIM2β knockout (KO) 3T3‐L1 cell lines. (A) qPCR analysis to compare the expression level of PPARγ2 between wild‐type (WT) and STIM2β KO 3T3‐L1 cell lines during early time points of differentiation. This data represents triplicated results, and the experiment was repeated more than 3 times. A two‐way ANOVA test combined with Bonferroni correction was used to evaluate the statistical significance. (B) Expression level of PPARγ isoforms after differentiation induction analyzed using western blotting. This data is representative, and this experiment was repeated for 4 times. (C, D) Protein expression in (B) was analyzed by measuring the band intensity ratio of PPARγ1 (C) and PPARγ2 (D) to β‐actin at each time point; 4 independent blots were used for the analysis. (E) Expression level of PPARγ2 downstream target gene glucose transporter 4 (GLUT4) analyzed using RT‐PCR. This data is representative and this experiment was repeated 3 times. (F) qPCR analysis of PPARγ2 downstream target genes glucose transporter 4 (GLUT4), fatty acid binding protein 4 (aP2), and lipoprotein lipase (LPL) at the indicated differentiation days (Diff Day). This data represents triplicated results, and the experiment was repeated more than 3 times. For the statistical analysis, a two‐way ANOVA test combined with Bonferroni correction was used. (G) Expression of PPARγ2 after store‐operated Ca2+ entry (SOCE) inhibitor (YM‐585483) treatment in WT and STIM2β KO#1 cells. Cells were treated with MDI with or without 1 μm YM‐58483 for 12 h. This data represents triplicated results, and the experiment was repeated 2 times. One‐way ANOVA test combined with Turkey's multiple comparison test was used to evaluate the statistical significance. (H) Graphical description of the PPARγ2 promoter–reporter system. (I, J) PPARγ2 promoter assay in HEK293 cells. This data represents triplicated results, and the experiment was repeated 3 times. For the statistical analysis, a two‐way ANOVA test combined with Bonferroni's correction was used; Bars represent mean ± SEM. Levels of significance are as follows: ns, not significant; **, P < 0.01; ***, P < 0.001.
Fig. 6
Fig. 6
Alteration of STIM2β increases differentiation efficiency by enhancing peroxisome proliferator‐activated receptor gamma 2 (PPARγ2) expression in primary stromal vascular fraction (SVF) cells. (A) BODIPY staining showing the lipid accumulation in SVF cells that were induced to be differentiated by a hormonal cocktail for 8 days. This data is representative and the experiment was repeated 3 times. Scale bars indicate 50 μm; (B) Lipid droplet size analysis in (A). The size of a single lipid droplet was analyzed using the analyze particle function in imagej. This data represents the combined results from 3 repeated experiments. The one‐way ANOVA test combined with Bonferroni's Multiple Comparison Test was used to evaluate statistical significance. (C) PPARG2 transcription levels in WT and STIM2β KO SVF cells were analyzed by qPCR at indicated time points after differentiation induction. This data represents triplicated results, and the experiment was repeated 3 times. Two‐way ANOVA with Bonferroni's correction was used for the statistical analysis. (D–F) Expression levels of PPARγ2 target genes fatty acid binding protein 4 (aP2) (D), adiponectin (AdipoQ) (E), and glucose transporter 4 (GLUT4) (F) were analyzed on differentiation day 4 by qPCR. This data represents triplicated results, and the experiment was repeated 3 times. The one‐way ANOVA combined with Dunnett's Multiple Comparison Test was used to evaluate statistical significance; Bars represent mean ± SEM. Levels of significance are as follows: ns, not significant; *, P < 0.05; **, P < 0.01; ***, P < 0.001.
Fig. 7
Fig. 7
Hypertrophic white adipose tissue (WAT) development in STIM2β knockout (KO) mice. (A) H&E staining results of inguinal white adipose tissue (iWAT) and epididymal white adipose tissue (eWAT) of wild‐type (WT) and STIM2β KO mice. Images were acquired using EVOS. Scale bars indicate 100 μm. (B) Average adipocyte size analysis in iWAT of WT and STIM2β KO mice. To evaluate statistical significance, one‐way ANOVA combined with Dunnett's multiple comparison test was used. (C) Average adipocyte size analysis in eWAT of WT and STIM2β KO mice. One‐way ANOVA combined with Dunnett's multiple comparison test was used to evaluate the statistical significance. The histological analysis of WT and STIM2β KO mice was repeated 3 times; Bars represent mean ± SEM. Levels of significance are as follows: *, P < 0.05; ***, P < 0.001.

Similar articles

References

    1. Choe SS, Huh JY, Hwang IJ, Kim JI & Kim JB (2016) Adipose tissue remodeling: its role in energy metabolism and metabolic disorders. Front Endocrinol 7, 30. - PMC - PubMed
    1. Tang QQ, Otto TC & Lane MD (2003) Mitotic clonal expansion: a synchronous process required for adipogenesis. Proc Natl Acad Sci U S A 100, 44–49. - PMC - PubMed
    1. Qiu Z, Wei Y, Chen N, Jiang M, Wu J & Liao K (2001) DNA synthesis and mitotic clonal expansion is not a required step for 3T3‐L1 Preadipocyte differentiation into adipocytes. J Biol Chem 276, 11988–11995. - PubMed
    1. Guo W, Zhang K‐M, Tu K, Li Y‐X, Zhu L, Xiao H‐S, Yang Y & Wu J‐R (2009) Adipogenesis licensing and execution are disparately linked to cell proliferation. Cell Res 19, 216–223. - PubMed
    1. Tang QQ & Lane MD (2012) Adipogenesis: from stem cell to adipocyte. Annu Rev Biochem 81, 715–736. - PubMed