. 2025 May 9;20(5):e0322715.
doi: 10.1371/journal.pone.0322715. eCollection 2025.

MiR-129-5p alleviates depression and anxiety by increasing astrocyte ATP production partly through targeting deubiquitinase Mysm1

Affiliations

MiR-129-5p alleviates depression and anxiety by increasing astrocyte ATP production partly through targeting deubiquitinase Mysm1

Qiaozhen Qin et al. PLoS One. .

Abstract

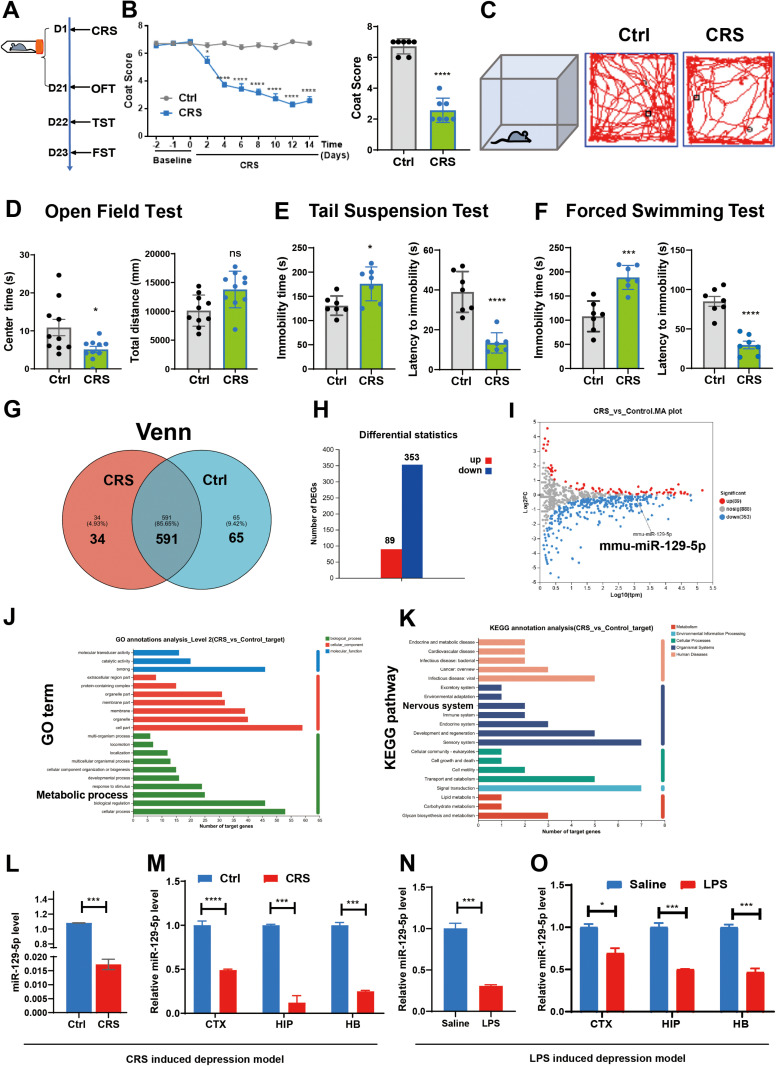
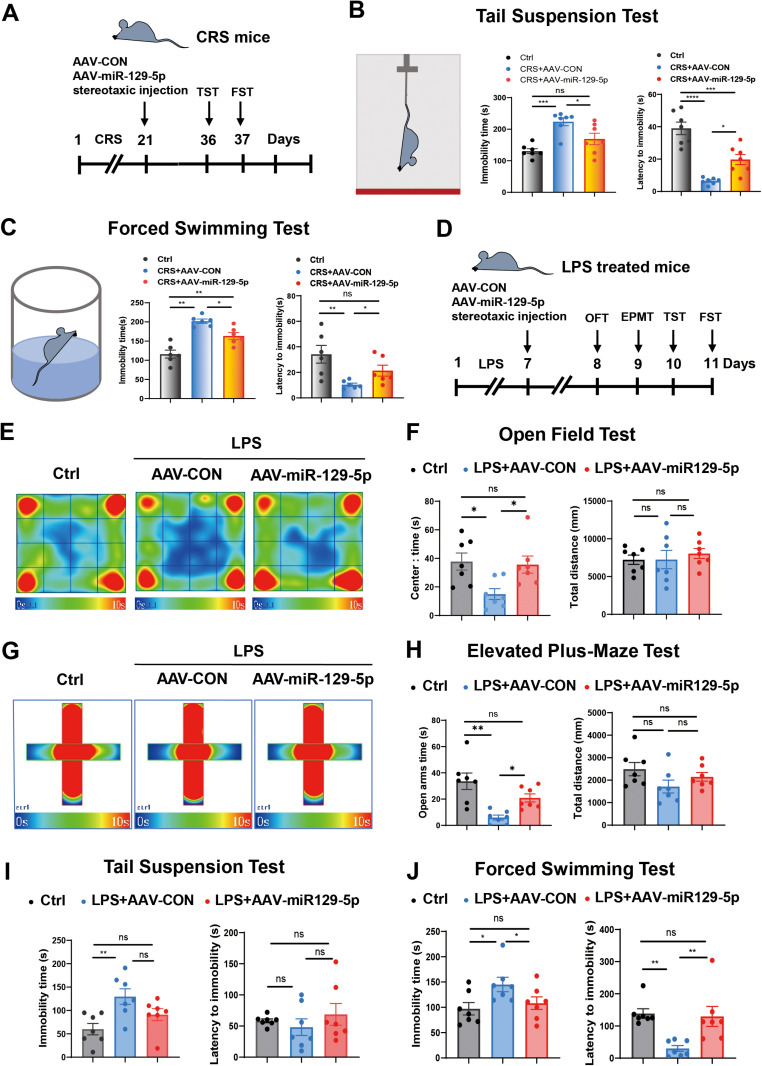
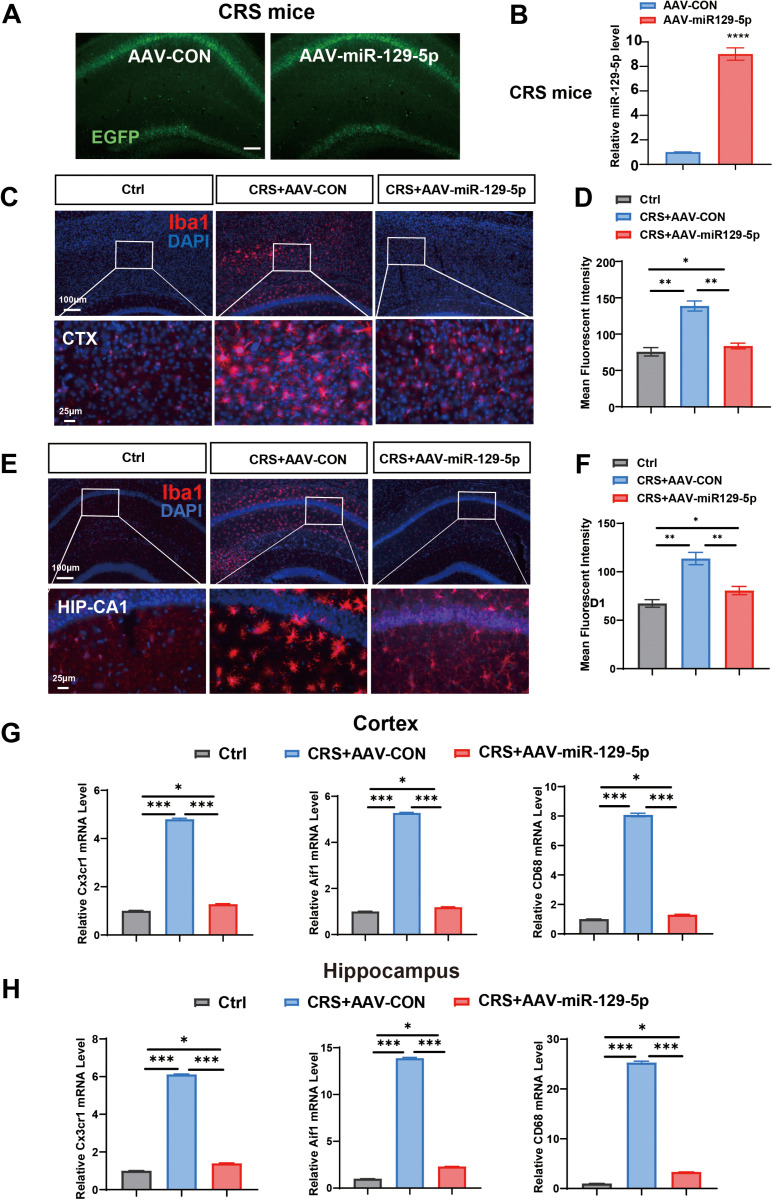
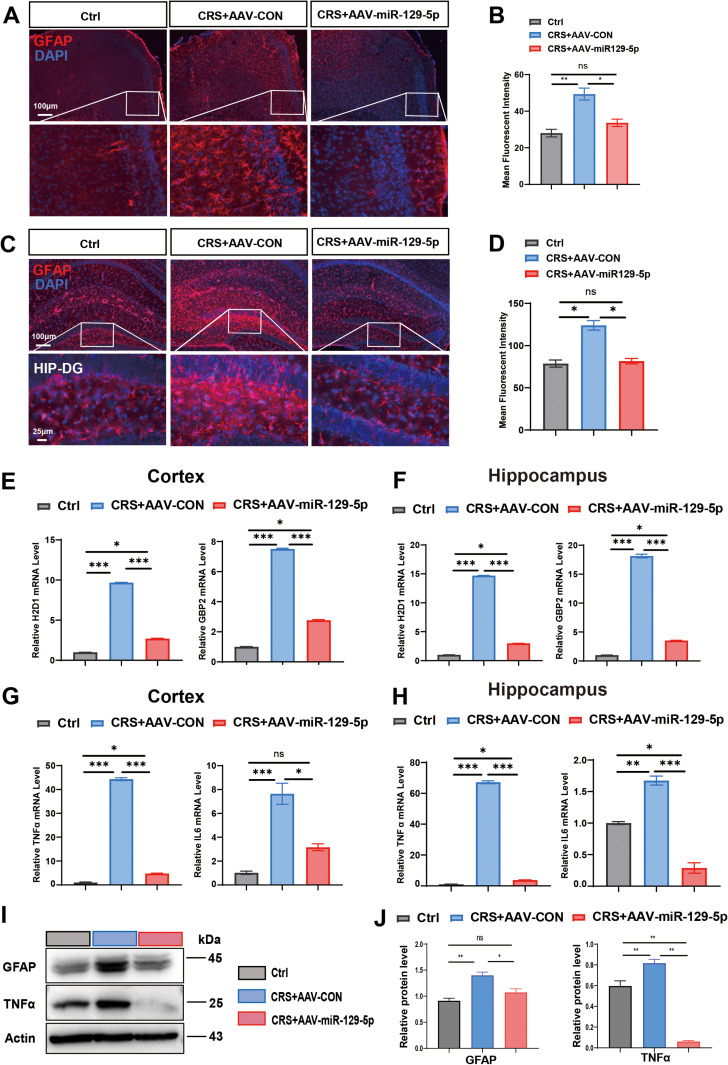
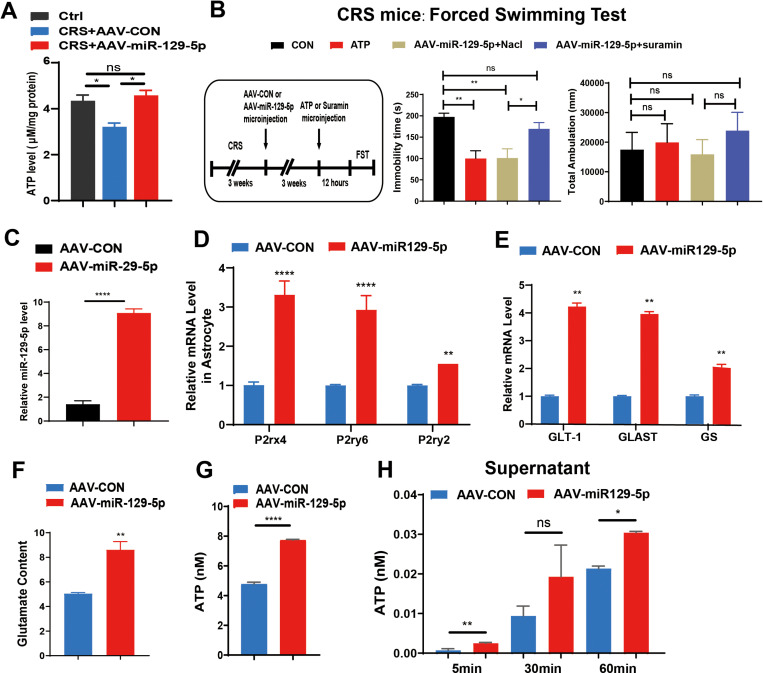
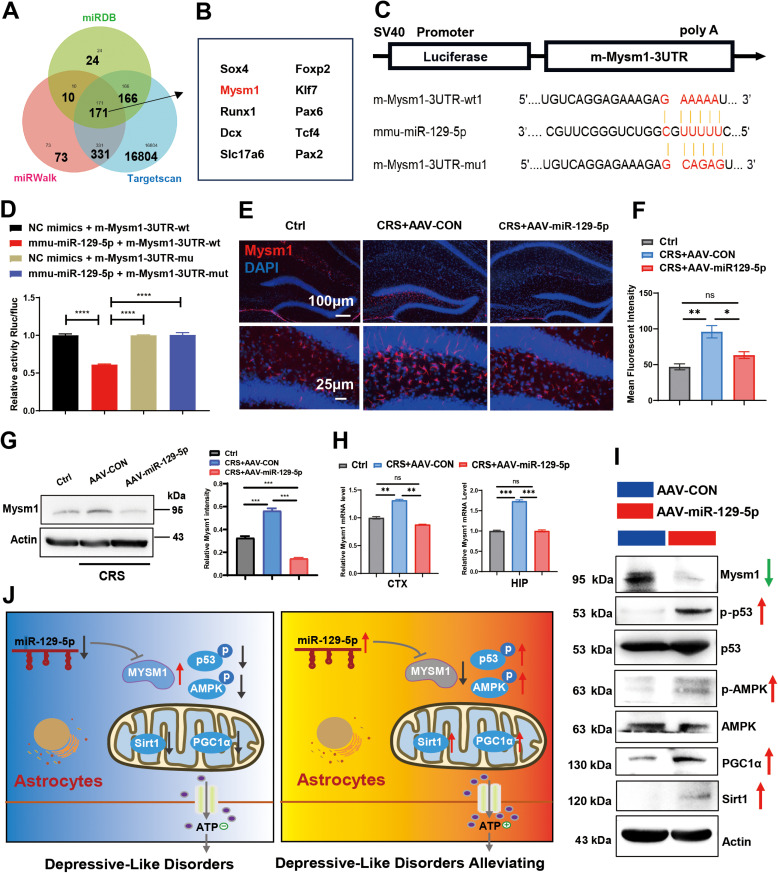
Major depressive disorder (MDD) is a major global mental concern that severely affects quality of life, yet current pharmacological treatments remain limited in their effectiveness. Long-term chronic stress has been shown to increase the incidence of depression and anxiety. Micro RNAs (miRNAs) have been revealed to participate in the pathological process of depression and represent promising therapeutic targets. In this study, we found that microRNA-129-5p (miR-129-5p) was significantly decreased in the brains of depressive mice. Overexpression of miR-129-5p in the hippocampus effectively alleviated depressive-like behaviors and reduced the activation of microglial cells and astrocytes. In addition, ATP levels in depressive mice were significantly increased following miR-129-5p overexpression. The antidepressant effects of miR-129-5p were reversed when ATP function was blocked with the non-specific P2 receptor antagonist suramin. In vitro experiments revealed that miR-129-5p overexpression enhanced ATP production in astrocytes. Furthermore, using a dual-luciferase reporter assay, we found that miR-129-5p directly targeted Mysm1. When overexpressed in astrocytes, miR-129-5p significantly suppressed Mysm1 expression, promoted phosphorylation of p53 and AMPK, and enhanced the expression of PGC1α, factors previously associated with ATP production. Our findings highlight the crucial role of miR-129-5p in regulating depression, suggesting that miR-129-5p overexpression may serve as an effective strategy for antidepressant treatment.


Conflict of interest statement

The authors have declared that no competing interests exist.

Figures

Fig 1
Fig 1. MiR-129-5p levels were decreased in mouse depression models.
A. Experimental schedule. All mice underwent behavioral tests following CRS treatment. B. Coat scores were assessed for the control and CRS groups from 0 to day 14. C. Representative route maps were conducted in the open field tests. D. Center time and total distance traveled by the control and CRS groups were displayed in the open field tests. E, F. Immobility time (left) and latency to immobility time (right) were recorded for the control and CRS groups in the tail suspension test (E) and in the forced swimming test (F). G. A Venn diagram illustrated differentially expressed miRNAs between control and CRS mice. H. Histogram depicting the distribution of increased and decreased miRNAs between control and CRS mice. I. Volcano plot illustrated the differentially expressed miRNAs between control and CRS mice. The Y-axis represents the fold change, while the X-axis indicates the significance of differential expression. The gray points represent miRNAs with no significant change (p < 0.05, false discovery rate (FDR) q < 0.05), while red and blue points indicate upregulated and downregulated miRNAs (p < 0.05, FDR q < 0.05), respectively. J. Gene ontology enrichment analysis quantifies target genes in each term. The richness factor was calculated by dividing the number of target genes by the total number of genes within each term. The scatterplot indicates the number of GO target genes, p-value and richness factor. K. The KEGG pathway analysis identifies the number of target genes within each pathway. Those with a p-value < 0.05 are considered significant. L. Relative expression of miR-129-5p in the control and CRS groups. M. Relative expression of miR-129-5p in the CTX, HIP, and HB of control and CRS mice. N. Relative expression of miR-129-5p in the saline and LPS-treated group. O. Relative expression of miR-129-5p in the CTX, HIP, and HB regions of saline and LPS treated group. (n = 3 - 10 mice per group; Data are presented as the mean ± standard error; *, **, ***, and **** indicate significance at p < 0.05, p < 0.01, p < 0.001, and p < 0.0001, respectively.).
Fig 2
Fig 2. Overexpression of miR-129-5p alleviated the depressive-like phenotypes of CRS and LPS treated mice.
A. Experimental schedule. The experimental paradigm involved virus injection into depressive mice following CRS treatment. B, C. Immobility time and latency to immobility of each group in the tail suspension test (B) and in the forced swimming test (C). D. Experimental schedule. The experimental paradigm illustrated the virus injection into depressive mice following LPS treatment. E. Typical route map of control, AAV-CON, and AAV-miR-129-5p LPS-treated mice were displayed in open field test. F. Center time duration and total distance traveled by each group were displayed in the open field test. G. Heatmap of control, AAV-CON, and AAV-miR-129-5p of LPS treated mice in the elevated plus-maze test. H. Time spent in open arms and total distance traveled by the three groups were measured in elevated plus-maze test. I, J. Immobility time and latency to immobility of each group in the tail suspension test (I) and in the forced swimming test (J). (n = 6-7 mice per group; Data are presented as the mean ± standard error; *, **, ***, and **** indicate significance at p < 0.05, p < 0.01, p < 0.001, and p < 0.0001, respectively.).
Fig 3
Fig 3. Stereotactic injection of AAV-miR-129-5p attenuated microglia activation in depressed mice.
A. EGFP fluorescence visualization in brain tissues three weeks after the stereotactic injection of AAV-CON and AAV-miR-129-5p virus. Scale bar, 100 μm. B. miR-129-5p expression was assessed by qRT-PCR analysis in the brain tissues. C. Representative Iba1-stained coronal sections of murine brain cortex from each group. Scale bar, 100 μm and 25 μm. D. Quantification of the mean fluorescence intensity of Iba1 in the cortex. E. Representative Iba1-stained coronal sections of murine hippocampus from the three groups. Scale bar, 100 μm and 25 μm. F. Quantitative analysis of the mean fluorescence intensity of Iba1 in the hippocampus. G, H The expression of Cx3cr1, Aif1 and CD68 was assessed by qRT-PCR in the cortex (G) and hippocampus of each group (H). (n = 3 - 4 mice per group; Data are presented as the mean ± standard error; *, **, ***, and **** indicate significance at p < 0.05, p < 0.01, p < 0.001, and p < 0.0001, respectively.).
Fig 4
Fig 4. Stereotactic injection of AAV-miR-129-5p suppressed astrocyte activation in depressed mice.
A. Representative GFAP-stained coronal sections of murine brains from the three groups in the cortex. Scale bar, 100 μm and 25 μm. B. Quantification of mean fluorescent intensity of GFAP in each group within the cortex. C. Representative GFAP-stained coronal sections of murine hippocampus from the three groups. Scale bar, 100 μm and 25 μm. D. Quantification of mean fluorescent intensity of GFAP in each group in the hippocampus. E, F. Expression levels of H2D1 and GBP2 in the cortex (E) and in the hippocampus (F) of each group, as detected by qRT-PCR. G, H. Expression levels of the pro-inflammatory factors TNFα and IL6 in the cortex (G) and hippocampus (H) of the three groups, as detected by qRT-PCR. I. Western blot analysis of GFAP and TNFα in the cortex and hippocampus following injection with control (AAV-CON) and miR-129-5p overexpression virus (AAV-miR-129-5p), respectively. J. Relative protein expression levels of GFAP and TNFα in the three groups. (n = 3 - 4 mice per group; Data are presented as the mean ± standard error; *, **, ***, and **** indicate significance at p < 0.05, p < 0.01, p < 0.001, and p < 0.0001, respectively).
Fig 5
Fig 5. Overexpression of miR-129-5p alleviated depression-like behaviors by increasing ATP content.
A. Relative miR-129-5p levels in brain tissues of the three groups. B. Immobility time (left) and latency to immobility time (right) of each group in the forced swimming test. C. Relative expression levels of miR-129-5p in primary astrocytes following virus infection. D. Relative expression levels of P2rx4, P2ry2, and P2ry6 in primary astrocytes. E. Relative expression levels of GLT-1, GLAST, and GS in the two groups. F. Comparison of glutamate content between the control (AAV-CON) and miR-129-5p overexpression (AAV-miR-129-5p) groups. G. ATP levels measured in the supernatant of primary astrocytes after transduction with the indicated control virus (AAV-CON) or miR-129-5p overexpression virus (AAV-miR-129-5p). H. ATP levels measured in primary astrocyte supernatant after transduction with the indicated control virus (AAV-CON) or miR-129-5p overexpression virus (AAV-miR-129-5p). (n = 3 - 10 mice per group; Data are presented as the mean ± standard error; *, **, ***, and **** indicate significance at p < 0.05, p < 0.01, p < 0.001, and p < 0.0001, respectively).
Fig 6
Fig 6. Relationship between miR-129-5p and Mysm1 in depressed mice.
A. A Venn diagram displaying potential targets of miR-129-5p analyzed by TargetScan, miRDB, and miRWalk analyses. B. The Mysm1 gene was identified and chosen for further in-depth study. C. Bioinformatics analysis revealed the prediction of miR-129-5p binding sites within the 3′UTR of Mysm1 mRNA. D. Luciferase activity assays of Mysm1 3′UTR reporters in 293T cells transduced with miR-129-5p, miR-129-5p-mutant, or negative control. The relative luciferase activity in negative control-transfected 293T cells was designated as 1. E. Representative images of immunofluorescence staining with Mysm1 (red) antibody and DAPI (blue) in the hippocampus. Scale bar, 100 μm and 25 μm. F. Quantification of mean fluorescent intensity of Mysm1 in the hippocampus region. G. Protein expression levels of Mysm1 were examined by western blotting assays (left) and quantification of Mysm1 was shown (right). H. The expression levels of Mysm1 were analyzed by qRT-PCR. I. Western blot analysis was performed to show the the protein levels. J. Schematic diagram illustrates the miR-129-5p/Mysm1 axis in astrocytes during depression. After injecting AAV-miR129-5p into depressive mice, Mysm1 expression was downregulated in the astrocytes. Inhibition of astrocytic Mysm1 alleviates depressive-like disorders by activating the p53 and AMPK pathways, thus enhancing ATP production. (n = 3 - 4 mice per group; Data are presented as the mean ± standard error; *, **, ***, and **** indicate significance at p < 0.05, p < 0.01, p < 0.001, and p < 0.0001, respectively).

Similar articles

References

    1. Ormel J, Hollon SD, Kessler RC, Cuijpers P, Monroe SM. More treatment but no less depression: The treatment-prevalence paradox. Clin Psychol Rev. 2022;91:102111. doi: 10.1016/j.cpr.2021.102111 - DOI - PubMed
    1. Marwaha S, Palmer E, Suppes T, Cons E, Young AH, Upthegrove R. Novel and emerging treatments for major depression. Lancet. 2023;401(10371):141–53. doi: 10.1016/S0140-6736(22)02080-3 - DOI - PubMed
    1. Wang R, Kogler L, Derntl B. Sex differences in cortisol levels in depression: A systematic review and meta-analysis. Front Neuroendocrinol. 2024;72:101118. doi: 10.1016/j.yfrne.2023.101118 - DOI - PubMed
    1. Thapar A, Eyre O, Patel V, et al.. Depression in young people. Lancet. 2022;400(10352):617-31. - PubMed
    1. Shi Y, Wang Q, Song R, Kong Y, Zhang Z. Non-coding RNAs in depression: Promising diagnostic and therapeutic biomarkers. EBioMedicine. 2021;71:103569. doi: 10.1016/j.ebiom.2021.103569 - DOI - PMC - PubMed