. 2025 Jul;12(28):e2503579.
doi: 10.1002/advs.202503579. Epub 2025 May 8.

Neuronal FGF13 Inhibits Mitochondria-Derived Damage Signals to Prevent Neuroinflammation and Neurodegeneration in a Mouse Model of Parkinson's Disease

Affiliations

Neuronal FGF13 Inhibits Mitochondria-Derived Damage Signals to Prevent Neuroinflammation and Neurodegeneration in a Mouse Model of Parkinson's Disease

Nanshan Song et al. Adv Sci (Weinh). 2025 Jul.

Abstract

Fibroblast growth factor homologous factors (FHFs) are highly expressed in the central nervous system (CNS). It is demonstrated that the FHFs subfamily plays cardinal roles in several neuropathological diseases, while their involvement in Parkinson's disease (PD) has been so far scarcely investigated. From the publicly available Gene Expression Omnibus (GEO) datasets, FHF2 (also known as fibroblast growth factor 13, FGF13) alterations are described in PD patients. Fgf13 gene is significantly decreased in several PD mouse models, and its overexpression alleviates the PD-like pathological phenotype. Although FGF13 is highly expressed in neurons, it functions by preventing glia-dependent inflammatory processes. Mechanistically, FGF13 combines mitochondrial proteins such as MCHT2 (a protein localized on the mitochondrial outer membrane), to anchor mitochondria within the cytoplasm. Under PD-related stress, decreased neuronal FGF13 levels induce the release of the damaged mitochondria, which in turn activate microglia and astrocytes, thereby promoting neurodegeneration. Abacavir, an FDA-applied anti-retroviral drug, is identified to prevent excessive gliosis and neuron loss in both glia-neuron co-cultures and PD mouse models by rejuvenating FGF13 signaling. Collectively, neuronal FGF13 inhibits the transfer of stressed mitochondria to glia, thereby impeding neuroinflammation and neurodegeneration. Abacavir is a promising neuroprotectant and sets a brake to PD progression.

Keywords: FGF13; MTCH2; mitochondrial transfer; neuroinflammation; parkinson's disease.


Conflict of interest statement

The authors declare no conflict of interest.

Figures

Figure 1
Figure 1
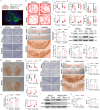
FGF13 is decreased in the nigrostriatal system of Parkinson's disease patients and parkinsonian mice. A). Venn diagram depicting the overlapped DEGs (Fold change > 2; P value < 0.05) in published RNA‐seq datasets (GSE7621, GSE8397, GSE20186, GSE26927 and GSE206308). B). Heat map of the overlapping DEGs expression in GES206308 (n  =  3 for the healthy group, n  =  4 for the disease group). C). FGF13 gene expression in the SN of PD patients from the published RNA‐seq datasets (GSE7621: n  =  9 for the healthy group, n  =  16 for the disease group; GSE8397‐GPL96 platform: n  =  6 for the lateral SN of healthy group, n  =  10 for the lateral SN of disease group; GSE8397‐GPL96 platform: n  =  8 for the medial SN of healthy group, n  =  15 for the medial SN of disease group; GSE20186‐GPL96 platform: n  =  14 for the healthy group, n = 14 for the disease group; GSE26927: n  =  8 for the healthy group, n = 12 for the disease group; GSE206308: n  =  3 for the healthy group, n  =  4 for the disease group). D). Fgf13 mRNA level in the midbrain of PD mouse models (n = 5–6 mice per group). E). The correlation between FGF13 and TH gene expression in the SN of PD patients from the published RNA‐seq datasets. F). Representative fluorescent images showing FGF13 (red) and TH (green) in the SNc of mice subjected to subacute MPTP administration. G). The relative fluorescent intensities of TH and FGF13 in the SNc of mice subjected to subacute MPTP administration, along with the correlation between them (n = 4 mice per group). H). Representative fluorescent images demonstrating FGF13 (red) and TH (green) in the SNc of mice under chronic MPTP administration (MPTP/p mouse model). I). The relative fluorescent intensities of TH and FGF13 in the SNc of MPTP/p mice, as well as the correlation between them (n = 4 mice per group). J). Representative fluorescent images depicting FGF13 (red) and TH (green) in the SNc of mice with α‐synuclein PFF micro‐injection. K). The relative fluorescent intensity of TH and FGF13 in the SNc mice with α‐synuclein PFF micro‐injection, along with the correlation between them (n = 4 mice per group). L). Representative immunoblots of TH and FGF13 in the midbrain of MPTP/p‐administrated mice. M). Quantitative analysis of TH and FGF13 in the midbrain of MPTP/p‐administrated mice, and the correlation (n = 6 per group). N). FGF13 gene expression in the putamen (PUT) of the PD patients from published RNA‐seq datasets (GSE205450: n  =  40 for the PUT of healthy group, n  =  35 for the PUT of disease group). O. FGF13 gene expression in the caudate (CAU) of the PD patients from published RNA‐seq datasets (GSE205450: n  =  40 for the CAU of healthy group, n  =  35 for the CAU of disease group). P). Representative immunoblots of FGF13 in the striatum of PD mice subjected to chronic MPTP administration. Q). Fgf13 mRNA level in the striatum of MPTP/p mice (n = 5–6 mice per group). R). Quantitative analysis of FGF13 levels in the striatum of MPTP/p mice (n = 4 mice per group). S). FGF13 levels in tissue lysates from the midbrain and striatum of MPTP/p mice measured using an ELISA assay (n = 6 mice per group). All data are presented as the mean ± s.e.m. * p < 0.05, ** p < 0.01, *** p < 0.001. In C; D; the upper panel of G, I, and K; left panel of M; N; O; Q; R, and S, an unpaired two‐tailed Student's t‐test was used. In E; lower panel of G, I, and K; right panel of M, a Pearson correlation test was used.
Figure 2
Figure 2
FGF13 is predominantly expressed in neurons and decreased in response to PD neurotoxin. A). Fgf13 gene expression in different cell types of adult mouse cortex from a published RNA‐seq dataset (GSE52564: n = 2 for each group; EC means endothelial cell, MO means myelinating oligodendrocyte, NFO means newly formed oligodendrocyte and OPC means oligodendrocyte precursor). B). The Fgf13 mRNA level in primary neurons, astrocytes, and microglia (n = 4 replicate experiments per group). C). FGF13 protein levels in lysates of primary cells lysed by NP‐40 buffer and SDS buffer. D). Quantitative analysis of FGF13 protein levels in cell lysates prepared using NP‐40 buffer (n = 6 replicate experiments per group). E). Quantitative analysis of FGF13 protein levels in cell lysates prepared using SDS buffer (n = 6 replicate experiments per group). F). Representative fluorescent images of FGF13 (red) and cell markers (green) in primary neurons marked by MAP2, astrocytes marked by GFAP, and microglia marked by Iba‐1. G). The relative fluorescent intensity of FGF13 in primary neural cells (6 images per group from 3 independent experiments). H). Co‐localization of FGF13 with cell body and nucleus in primary neurons, astrocytes, and microglia. I). Fgf13 mRNA level in primary neurons upon MPP+ stimulation (n = 7–9 replicate experiments per group). J). FGF13 protein levels in lysates of primary neurons with MPP+ stimulation (n = 4 replicates per group). K). Representative fluorescent images of MAP2 (red) and FGF13 (green) in primary neurons stimulated with 10 µm MPP+ for 24 h. L). Quantitative analysis of FGF13‐positive signals in primary neurons (10 images per group from 3 independent experiments). M). Quantitative analysis of MAP2‐positive neurite length in primary neurons (10 images per group from 3 independent experiments). N). The correlation between the relative FGF13‐positive signals and the relative length of MAP2‐positive neurites in primary neurons stimulated with MPP+. All data are presented as the mean ± s.e.m. *** p < 0.001; n.s means no significance. In I and J, a one‐way ANOVA with Dunnett's multiple comparisons test was used. In L and M, an unpaired two‐tailed Student's t‐test was used. In N, a Pearson correlation test was used.
Figure 3
Figure 3
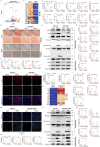
Genetic manipulation of neuronal Fgf13 influences MPTP/p‐induced motor dysfunctions and dopaminergic neuron death. A). The strategy for injecting AAV into the SN of mice, along with the EGFP expression pattern in the midbrain after AAV injection. B). Representative movement tracks of mice in the OFT. C). The mean moving distance of mice in the OFT (n = 15 mice per group). D). The time that mice remained on the rotating rod in the rotarod test (n = 15 mice per group). E). The time taken by mice to turn around the top of the pole (T‐turn, left panel) and the time to descend the pole (descending time, right panel) in the pole test (n = 15 mice per group). F). Levels of dopamine and DOPAC in the striatum of mice (n = 9–11 mice; DOPAC means homoprotocatechuic acid). G). Representative images of Nissl staining in the SNc of mice. H). Representative immunohistological images of TH in the SNc of mice. I). Relative neuron numbers in the SNc of mice (n = 6 mice per group). J). Stereological counts of TH+ cells in the SNc (n = 6 mice per group). K). Representative immunoblots of TH and FGF13 in the midbrain. L). Quantitative analysis of FGF13 and TH proteins in immunoblotting (n = 4 mice per group). M). Representative immunohistological images of TH in the striatum of mice. N). Relative optical intensity of TH in the striatum of mice (n = 6 mice per group). O). The moving distance of mice in the OFT and the duration that mice stayed on the rotating rod in the rotarod test (n = 12–18 mice per group for the OFT and n = 15 for the rotarod test). P). T‐turn and descending time in the pole test (n = 15 mice per group). Q). Representative images of Nissl staining in the SNc. R). Representative immunohistological images of TH in the SNc of mice. S). The relative neuron numbers and stereological counts of TH‐positive cells in the SNc (n = 6 mice per group). T). Representative immunoblots of TH and FGF13 in the midbrain. U). Quantitative analysis of FGF13 and TH (n = 4 mice per group). All data are presented as the mean ± s.e.m. *p < 0.05, ** p < 0.01, and *** p < 0.001 versus. AAV‐Con Saline group; # p < 0.05, ## p < 0.01, and ### p < 0.001 versus. AAV‐Con MPTP/p group; n.s means no significance. Statistical comparison was performed using two‐way ANOVA.
Figure 4
Figure 4
Neuronal FGF13 regulates neuroinflammation and glial reactivity in the nigrostriatal pathway. A). Volcano plot of the DEGs (|log2 fold change| ≥ 1 and adjusted P < 0.05) in AAV‐Fgf13 MPTP/p versus. AAV‐Con MPTP/p was identified through RNA‐sequencing analysis of nigrostriatal tissues. B). Heat map presenting the expression of inflammatory genes and chemokines identified by RNA‐seq. C). Levels of inflammatory cytokines and chemokines in the lysates of nigrostriatal tissues by ELISA assay (n = 6 mice per group). D). Representative immunohistological images of Iba‐1 and GFAP in the SNc of mice. E). Quantitative analysis of Iba‐1‐positive area and intensity in the SNc of mice (n = 4 mice per group). F). Quantitative analysis of GFAP‐positive area and intensity in the SNc of mice (n = 5–6 mice per group). G). Representative immunoblots of NLRP3, phosphorylated p65 (P‐p65), p65, Caspase‐1 (Cas‐1), and IL‐1β in total lysates; as well as P‐p65 and p65 in the nuclear lysates of the midbrain tissues. H. Quantitative analysis of NLRP3, P‐p65, p65, Cas‐1, and IL‐1β in total lysates; and P‐p65 and p65 in nuclear lysates in the immunoblotting experiment (n = 3 replicates per group). I. Representative fluorescent images of GFAP (red) and Iba‐1 (grey) in the striatum of mice. J). Quantitative analysis of Iba‐1‐ and GFAP‐positive fluorescent signals in the striatum (n = 3–4 mice per group). K). Heat map presenting the expression of inflammatory genes and chemokines in the midbrain, as determined by qRT‐PCR. L). Levels of inflammatory cytokines and chemokines in the lysates of mesencephalic tissues by ELISA assay (n = 6 mice per group). M). Representative fluorescent images of GFAP (turquoise) and Iba‐1 (purple) in the midbrain (upper panel) and in the striatum (lower panel). N). Quantitative analysis of Iba‐1‐ and GFAP‐positive fluorescent signals in the midbrain (n = 4 mice per group). O). Quantitative analysis of Iba‐1‐ and GFAP‐positive fluorescent signals in the striatum (n = 4 mice per group). P). Representative immunoblots of NLRP3, Cas‐1, and IL‐1β in total lysates; as well as P‐p65 and p65 in the nuclear lysates of the midbrain tissues. Q). Quantitative analysis of NLRP3, P‐p65, p65, Cas‐1, and IL‐1β in total lysates; and P‐p65 and p65 in nuclear lysates in the immunoblotting experiments (n = 3 replicates per group). All data are presented as the mean ± s.e.m. * p < 0.05, ** p < 0.01, and *** p < 0.001 versus. AAV‐Con Saline group; # p < 0.05 and ## p < 0.01, and ### p < 0.001 versus. AAV‐Con MPTP/p group. Statistical comparison was performed using two‐way ANOVA.
Figure 5
Figure 5
FGF13 modulates neuronal damage and glial inflammatory events in a neuron‐glia co‐culture system. A). Representative fluorescent images of MAP2 (green) in primary neurons. B). The relative neurite length and cell number in MAP2‐positive neurons (5 images). C). Representative fluorescent images of TH (green) in primary neurons. D). The relative neurite length and cell number in TH‐positive dopaminergic neurons (6 images from 3 independent experiments). E). Representative immunoblots of TH in primary neurons. F). Quantitative analysis of TH in the immunoblotting experiments (n = 5 replicates per group). G). Heat map presenting the levels of inflammatory genes and chemokines in primary microglia by qRT‐PCR assay (n = 3 replicates per group). H). Representative fluorescent images of Iba‐1 (red), CD16 (green, marker of M1‐polarized microglia), and CD68 (grey, marker of activated microglia) in primary microglia. I). Representative fluorescent images of GFAP (green) and CD44 (red, marker of activated astrocytes) in primary astrocytes. J). The relative fluorescent intensities of CD16 (left panel) and CD68 (right panel) in primary microglia (4 images). K). The relative fluorescent intensity of CD44 in primary astrocytes (6 images from 3 independent experiments). L). Representative fluorescent images of MAP2 (green) in primary neurons. M). The relative neurite length and cell number in MAP2‐positive neurons (5 images). N). The representative fluorescent images of TH (green) in primary neurons. O). Relative neurite length and cell number in TH‐positive dopaminergic neurons (6 images from 3 independent experiments). P). Representative immunoblots of TH in primary neurons. Q). Quantitative analysis of TH in the immunoblotting experiments (n = 5 replicates per group). R). Heat map presenting the levels of inflammatory genes and chemokines in the mixed glial cultures by qRT‐PCR assay (n = 3 replicates per group). All data are presented as the mean ± s.e.m. ** p < 0.01 and *** p < 0.001 versus. Lenti‐vector Con group; # p < 0.01, ## p < 0.01, and ### p < 0.001 versus. Lenti‐vector MPP+ group; n.s means no significance. Statistical comparison was performed using two‐way ANOVA.
Figure 6
Figure 6
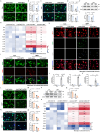
FGF13 restrains mitochondrial release from neurons. A). Experimental schematic for collecting extracellular mitochondria from neuron‐conditioned medium via differential ultracentrifugation. B). Left panel: representative fluorescent image of intracellular and extracellular mitochondria (Mitotracker green labels mitochondria, Hoechst labels the nuclei). Right panel: representative TEM images showing free mitochondria (pink circles) and vesicles (green circle) that contain mitochondria (pink circles). C). Representative TEM images of extracellular mitochondria. D). Quantitative analysis of extracellular mitochondria per picture (6 pictures from 3 replicates per group). E). The percentage of damaged mitochondria among all mitochondria in each picture (6 pictures from 3 replicates per group). F). Representative fluorescent images of extracellular mitochondria stained with Mitotracker green and MitoSOX Red. G). Quantitative analysis of Mitotracker green signals (6 images from 3 independent experiments). H. Quantitative analysis of MitoSOX Red signals (6 images from 3 independent experiments). I). Representative fluorescent images of extracellular mitochondria stained with JC‐1. J). The ratio of JC‐1 aggregate to JC‐1 monomer in extracellular mitochondria (5 images from 5 independent experiments). K). MitoSOX Red signals analyzed by flow cytometry. L. Ratio of JC‐1 aggregate to JC‐1 monomer in extracellular mitochondria analyzed by flow cytometry. M). Quantitative analysis of MitoSOX Red signals in flow cytometry (n = 3–6 replicates per group). N). Quantitative analysis of JC‐1 aggregate/JC‐1 monomer in flow cytometry (n = 5 replicates per group). O). Representative TEM images of extracellular mitochondria. P). Quantitative analysis of extracellular mitochondria per picture (6 pictures from 3 replicates per group). Q). The percentage of damaged mitochondria among all mitochondria in each picture (6 pictures from 3 replicates per group). R). Quantitative analysis of MitoSOX Red signals in flow cytometry (n = 6 replicates per group). S). Quantitative analysis of JC‐1 aggregate/JC‐1 monomer in flow cytometry (n = 6 replicates per group). All data are presented as the mean ± s.e.m. * p < 0.05, ** p < 0.01, and *** p < 0.001 versus. Lenti‐vector Con group; # p < 0.05, ## p < 0.01, and ### p < 0.001 versus. Lenti‐vector MPP+ group; n.s means no significance. Statistical comparison was performed using two‐way ANOVA.
Figure 7
Figure 7
Neuronal FGF13 modulates inflammatory responses in glia via regulating mitochondrial transfer. A). Representative fluorescent images of neuronal mitochondria (marked by Mito‐dsRed) and Ibal (green, upper panel), as well as GFAP (green, lower panel) in cell cultures. B). Quantitative analysis of neuronal mitochonria in microglia (left panel) and astrocytes (right panel) (6 images from 3 independent experiments). C). Quantitative analysis of Mito‐dsRed signals in microglia stimulated with mitochondria from Fgf13‐overexpressing neurons by flow cytometric analysis (n = 6 replicates per group). D). Quantitative analysis of Mito‐dsRed signals in astrocytes stimulated with mitochondria from Fgf13‐overexpressing neurons (n = 6 replicates per group). E). Quantitative analysis of Mito‐dsRed signals in microglia stimulated with mitochondria from Fgf13‐knockdown neurons (n = 6 replicates per group). F). Quantitative analysis of Mito‐dsRed signals in astrocytes stimulated with mitochondria from Fgf13‐knockdown neurons (n = 6 replicates per group). G). Representative fluorescent images of neuronal mitochondria (marked by Mito‐dsRed) and Ibal (turquoise, upper panel), as well as GFAP (turquoise, lower panel) in the midbrain slices. H). Quantitative analysis of neuronal mitochonria in microglia and astrocytes (right panel) (8 images from 4 independent experiments). I). Schematic diagram illustrating the treatment of mixed glial cultures with mitochondria collected from neuronal culture medium. J). Heat map presenting the levels of inflammatory genes and chemokines in mixed glial cultures (n = 3 replicates per group). K). Levels of inflammatory cytokines and chemokines in the surpernatant of mixed glial culture (n = 6 replicates per group). L. Representative immunoblots of NLRP3, P‐p65, p65, pro‐Cas‐1, and pro‐IL‐1β in total lysates; as well as Cas‐1 and IL‐1β in the surpernatant. M). Quantitative analysis of NLRP3, P‐p65, p65, Cas‐1 and IL‐1β (n = 3 replicates per group). N. Representative immunoblots of P‐p65 and p65 in the nuclear lysates of glial cultures. O). Quantitative analysis of P‐p65 and p65 in the nuclear lysates (n = 3 replicates per group). P). Heat map presenting the levels of inflammatory genes and chemokines in mixed glial cultures (n = 3 replicates per group). Q). Levels of inflammatory cytokines and chemokines in the surpernatant of mixed glial culture (n = 6 replicates per group). R). Representative immunoblots of NLRP3, P‐p65, p65, pro‐Cas‐1 and pro‐IL‐1β in total lysates; as well as Cas‐1 and IL‐1β in the surpernatant. S). Quantitative analysis of NLRP3, P‐p65, p65, Cas‐1 and IL‐1β (n = 3 replicates per group). T). Representative immunoblots of P‐p65 and p65 in the nuclear lysates of glial cultures. U). Quantitative analysis of P‐p65 and p65 (n = 3 replicates per group). All data are presented as the mean ± s.e.m. For H, *** p < 0.001 versus. AAV‐Con MPTP/p group. For other panels, * p < 0.05, ** p < 0.01, and *** p < 0.001 versus. Lenti‐vector Con group; # p < 0.05, ## p < 0.01, and ### p < 0.001 versus. Lenti‐vector MPP+ group; n.s means no significance. Statistical comparison was performed using two‐way ANOVA.
Figure 8
Figure 8
FGF13 interacts with mitochondrial proteins to prohibit mitochondrial leakage. A). Abundance of FGF13‐binding mitochondrial proteins in primary neurons assessed by mass spectrometry. B). Representative fluorescent images of FGF13 (green) and Mitotracker Red in primary neurons. C). The contacting length of FGF13 and mitochondria in the primary neurons. D). Co‐localization of FGF13 (green) and MTCH2 (red) in the HEK293T cell, with the cytoskeleton (F‐actin) visualized using phalloidin staining (turquoise). E). Detection of His‐FGF13 bound to GST‐MTCH2 or GST in a GST pull‐down assay. F–G). Co‐immunoprecipitation assay of FGF13 and MTCH2 in primary neurons. H). MitoSOX Red signals in the mitochondria‐containing pellets were analyzed by flow cytometry. I). Representative fluorescent images of extracellular mitochondria stained with JC‐1. J). Quantitative analysis of MitoSOX Red signals in the flow cytometry assay (n = 4–6 replicates per group). K). Ratio of JC‐1 aggregate to JC‐1 monomer in extracellular mitochondria (from 3 independent experiments). All data are presented as the mean ± s.e.m. For C, ** p < 0.01 versus. Con group. For other panels, *** p < 0.001 versus. Lenti‐vector Con group; $$p < 0.01 and $$$p < 0.001 versus. Lenti‐vector MPP+ group; &p < 0.05 and &&p < 0.01 versus. Lenti‐Fgf13 MPP+ group; n.s means no significance. Statistical comparison was performed using one‐way ANOVA with Dunnett's multiple comparisons test.
Figure 9
Figure 9
Abacavir elevates neuronal FGF13 to reduce neuroinflammation and dopaminergic neuron loss in the PD mouse model. A). Schematic diagram illustrating the process of screening for FGF13‐targeted neuroprotectants. B). Relative expression levels of Fgf13 gene in HEK293T cells treated with a library of 442 FDA‐approved BBB‐penetrant drugs. C). Fgf13 gene expression levels in primary neurons treated with candidate drugs detected by qRT‐PCR assay (n = 3 replicates per group; 1A: Control group, 2A: drug 1‐B11, 2B: drug 1‐D05, 2E: drug 1‐F11, 2G: drug 3‐B06, 3E: drug 4‐E07, 3I: drug 5‐E11, 3J: drug 5‐F08, 3K: drug 5‐H07). D). Representative immunoblots of FGF13 in primary neurons treated with candidate drugs. E). Quantitative analysis of FGF13 by immunoblotting (n = 4 replicate experiments per group). F). Structural formula of Abacavir and Abacavir sulfate. G). Representative fluorescent images of MAP2 (green) and Hoechst (blue) in primary neurons pretreated with Abacavir and then stimulated with MPP+. H). Relative neurite length and cell number in MAP2‐positive neurons (10 images per group from 3 independent experiments). I). Co‐immunoprecipitation assay of FGF13 and MTCH2 in primary neurons. J). Time for T‐turn and descending time in the pole test (n = 15 mice). K). Moving distance of mice in the OFT (n = 9–10 mice per group). L). Time of mice staying on the rotating rod in the rotarod test (n = 15 mice). M). Representative images of Nissl staining and representative immunohistological images of TH in the SNc of mice. N). Quantitative analysis of neuron numbers in the SNc of mice (n = 7–8 mice for Nissl staining). O). Quantitative analysis of TH‐positive neuron numbers in the SNc of mice (n = 10 mice per group). P). Representative fluorescent images of GFAP (green) and Iba‐1 (red) in the SNc. Q). Quantitative analysis of Iba‐1‐positive area and intensity in the SNc (n = 4 mice per group). R). Quantitative analysis of GFAP‐positive area and intensity in the SNc of mice (n = 4 mice per group). All data are presented as the mean ± s.e.m. * p < 0.05, ** p < 0.01, and *** p < 0.001 versus. Con or Saline group; $p < 0.05, $$p < 0.01, and $$$p < 0.001 versus. MPP+ or MPTP/p group. Statistical comparison was performed using one‐way ANOVA with Dunnett's multiple comparisons test.
Figure 10
Figure 10
The schematic model of neuronal FGF13 in inhibiting mitochondria‐derived damage signals to prevent neuroinflammation and neurodegeneration.

References

    1. Morris H. R., Spillantini M. G., Sue C. M., Williams‐Gray C. H., Lancet 2024, 403, 293. - PubMed
    1. Foltynie T., Bruno V., Fox S., Kuhn A. A., Lindop F., Lees A. J., Lancet 2024, 403, 305. - PubMed
    1. Luo L., Science 2021, 373, abg7285. - PMC - PubMed
    1. Allen N. J., Lyons D. A., Science 2018, 362, 181. - PMC - PubMed
    1. Borst K., Dumas A. A., Prinz M., Immunity 2021, 54, 2194. - PubMed

Substances

LinkOut - more resources