

Ca2+ sonotransfer into breast cancer cells in a suspension, 3-D spheroid and subcutaneous tumor models
- PMID: 40345105
- PMCID: PMC12136821
- DOI: 10.1016/j.ultsonch.2025.107381
Ca2+ sonotransfer into breast cancer cells in a suspension, 3-D spheroid and subcutaneous tumor models
Abstract
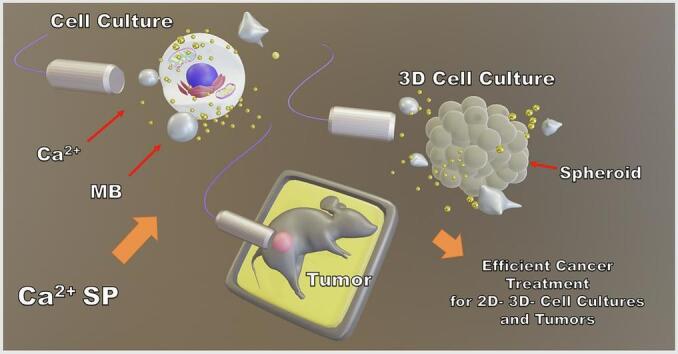
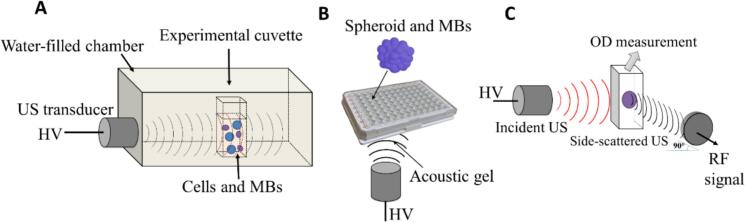
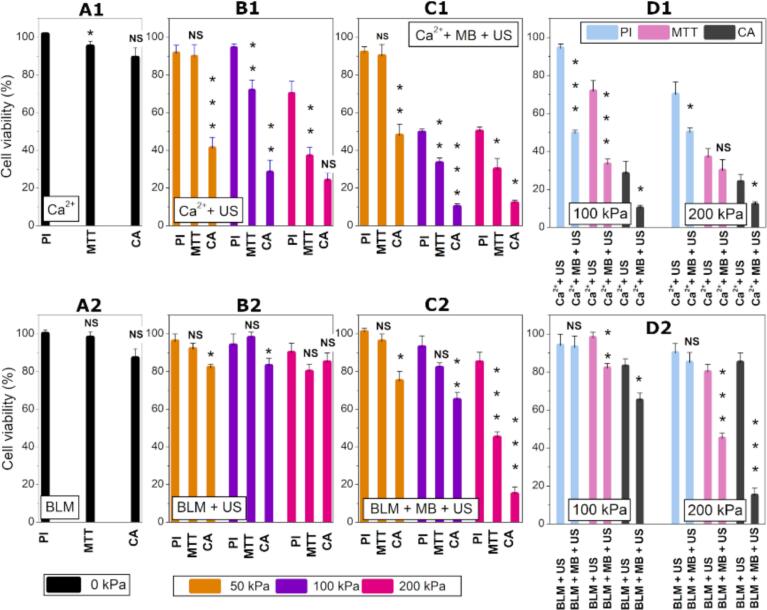
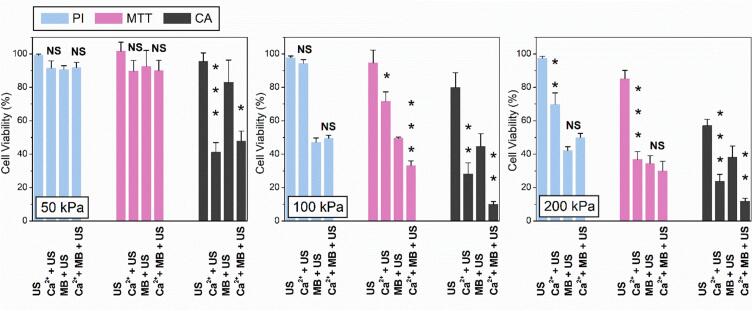
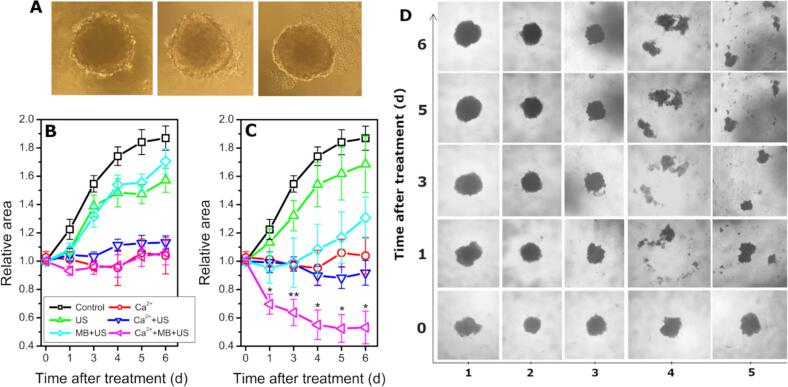
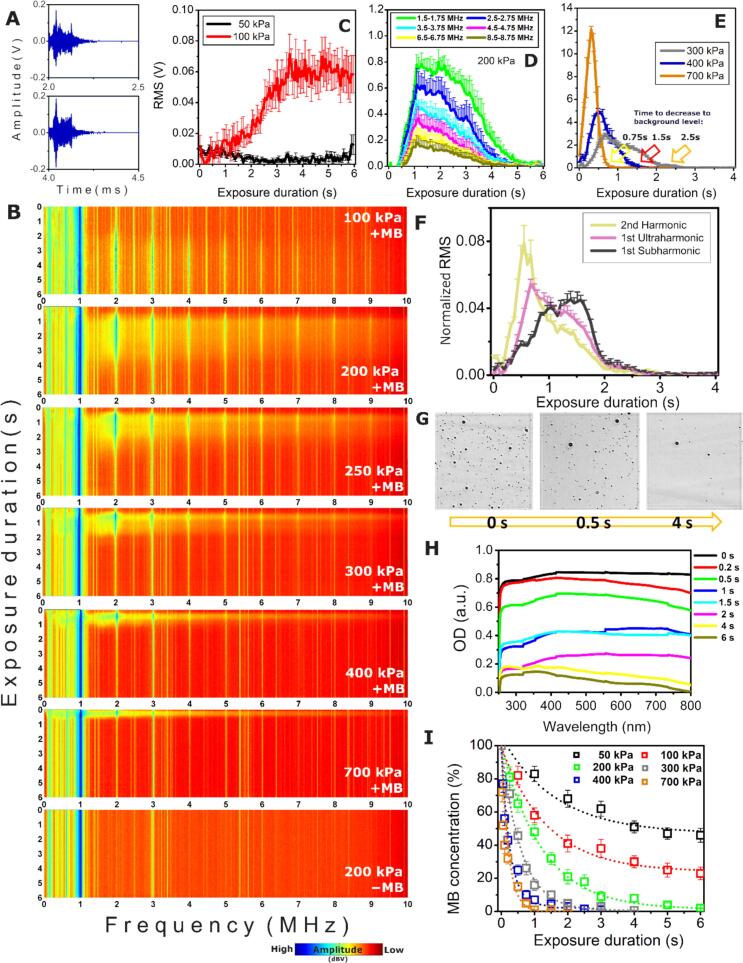
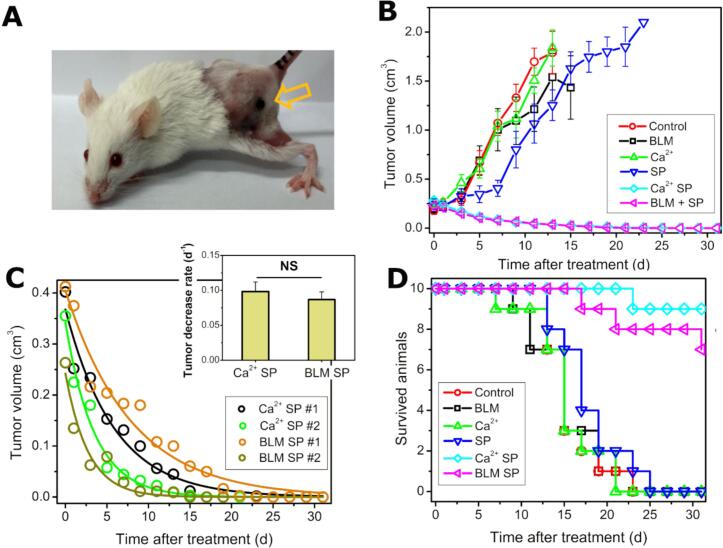
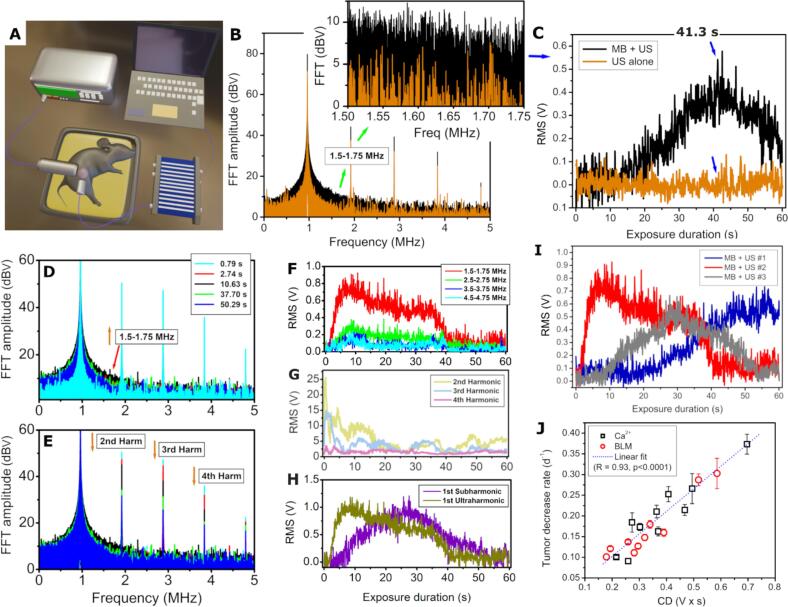
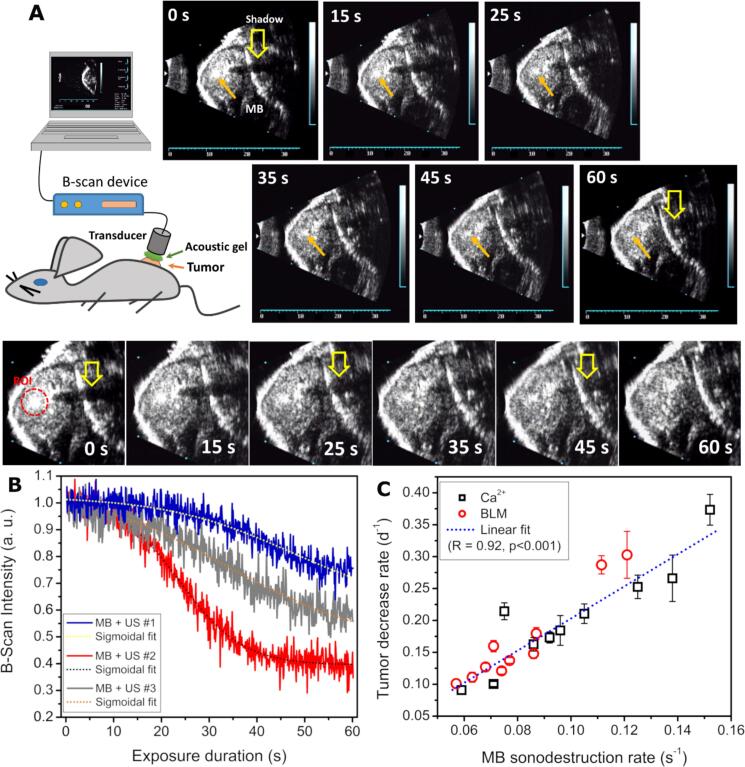
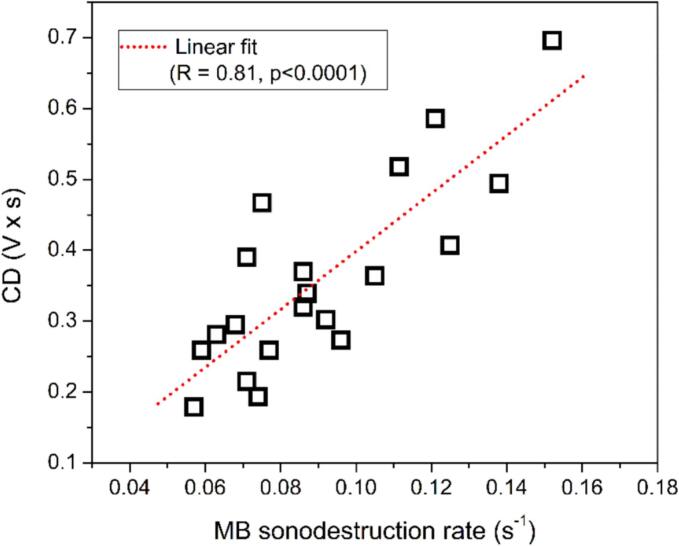
Calcium-based treatments have gained considerable attention in the field of electroporation, primarily, due to their comparable efficacy to conventional electro-chemotherapy. However, their applications in sonoporation remain under-investigated, despite its high potential for site-specific and temporally-controlled drug delivery. Current study examines the curative potential of calcium sonoporation across multiple experimental models, including: i) cell suspension, ii) 3-D spheroid culture and iii) subcutaneous murine breast cancer tumors. Murine breast cancer is an established analogue of stage IV human breast cancer. For comparison, parallel experiments, using classical anticancer drug bleomycin were performed. Ca2+ sonoporation efficiently enhanced 4 T1 cell death in a suspension in the absence of microbubbles, under relatively low acoustic pressure (100-200 kPa). In contrast, efficient spheroid growth reduction required microbubble-mediated inertial cavitation at higher (700 kPa) acoustic pressure. In vivo, Ca2+ sonoporation demonstrated similar tumor growth reduction as bleomycin sonoporation. Both treatments reduced tumor growth from the third day after the onset of treatment. Successful cancer treatment was achieved even at lower values of cavitation dose metrics. Our study presents a multi-level validation of Ca2+ sonoporation as an effective treatment strategy for murine breast cancer. Importantly, complete tumor eradication and prolonged animal survival up to one month were observed even at significantly reduced cavitation activity, indicating clinical safety of the treatment.
Keywords: 4T1 cells; Bleomycin; Breast cancer; Calcium; Sonoporation; Spheroids.
Copyright © 2025 The Authors. Published by Elsevier B.V. All rights reserved.
Conflict of interest statement
Declaration of competing interest The authors declare that they have no known competing financial interests or personal relationships that could have appeared to influence the work reported in this paper.
Figures
Similar articles
-
Dosimetric assessment of antitumor treatment by enhanced bleomycin delivery via electroporation and sonoporation.Bioelectrochemistry. 2022 Aug;146:108153. doi: 10.1016/j.bioelechem.2022.108153. Epub 2022 May 7. Bioelectrochemistry. 2022. PMID: 35567959
-
Control of Acoustic Cavitation for Efficient Sonoporation with Phase-Shift Nanoemulsions.Ultrasound Med Biol. 2019 Mar;45(3):846-858. doi: 10.1016/j.ultrasmedbio.2018.12.001. Epub 2019 Jan 11. Ultrasound Med Biol. 2019. PMID: 30638968 Free PMC article.
-
Enhancement of non-invasive trans-membrane drug delivery using ultrasound and microbubbles during physiologically relevant flow.Ultrasound Med Biol. 2015 Sep;41(9):2435-48. doi: 10.1016/j.ultrasmedbio.2015.05.003. Epub 2015 Jun 9. Ultrasound Med Biol. 2015. PMID: 26067786
-
Mechanisms underlying sonoporation: Interaction between microbubbles and cells.Ultrason Sonochem. 2020 Oct;67:105096. doi: 10.1016/j.ultsonch.2020.105096. Epub 2020 Mar 26. Ultrason Sonochem. 2020. PMID: 32278246 Review.
-
Bursting bubbles and bilayers.Theranostics. 2012;2(12):1140-59. doi: 10.7150/thno.4305. Epub 2012 Dec 11. Theranostics. 2012. PMID: 23382772 Free PMC article. Review.
References
-
- J.P. Brandt, V. Gerriets, Bleomycin, StatPearls [Internet], StatPearls Publishing, Treasure Island (FL), 2021. pubmed.ncbi.nlm.nih.gov/32310355/.
-
- K. Johnson-Arbor, R. Dubey, Doxorubicin, StatPearls [Internet], StatPearls Publishing, Treasure Island (FL), 2023. pubmed.ncbi.nlm.nih.gov/29083582/. - PubMed
-
- Kotopoulis S., Delalande A., Popa M., Mamaeva V., Dimcevski G., Gilja O.H., Postema M., Gjertsen B.T., McCormack E. Sonoporation-enhanced chemotherapy significantly reduces primary tumour burden in an orthotopic pancreatic cancer xenograft. Mol. Imaging Biol. 2014;16:53–62. doi: 10.1007/s11307-013-0672-5. - DOI - PubMed
MeSH terms
Substances
LinkOut - more resources
Full Text Sources
Medical
Miscellaneous
