. 2025 May 20;6(5):102127.
doi: 10.1016/j.xcrm.2025.102127. Epub 2025 May 8.

Dysfunctional one-carbon metabolism identifies vitamins B6, B9, B12, and choline as neuroprotective in glaucoma

Affiliations

Dysfunctional one-carbon metabolism identifies vitamins B6, B9, B12, and choline as neuroprotective in glaucoma

James R Tribble et al. Cell Rep Med. .

Abstract

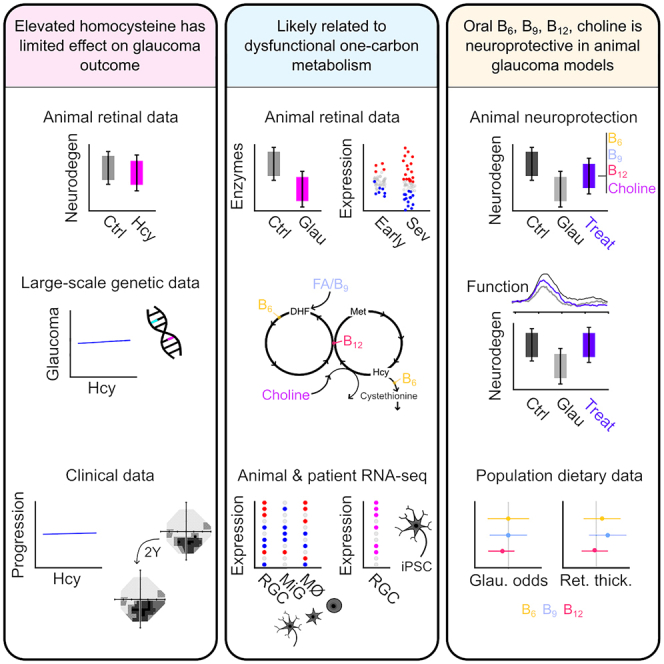
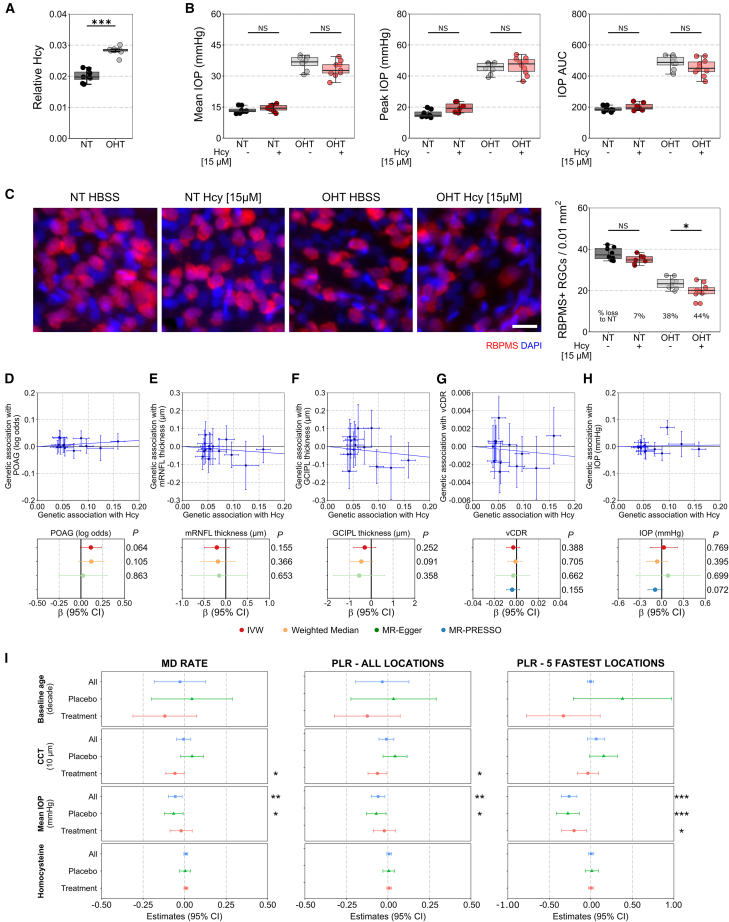
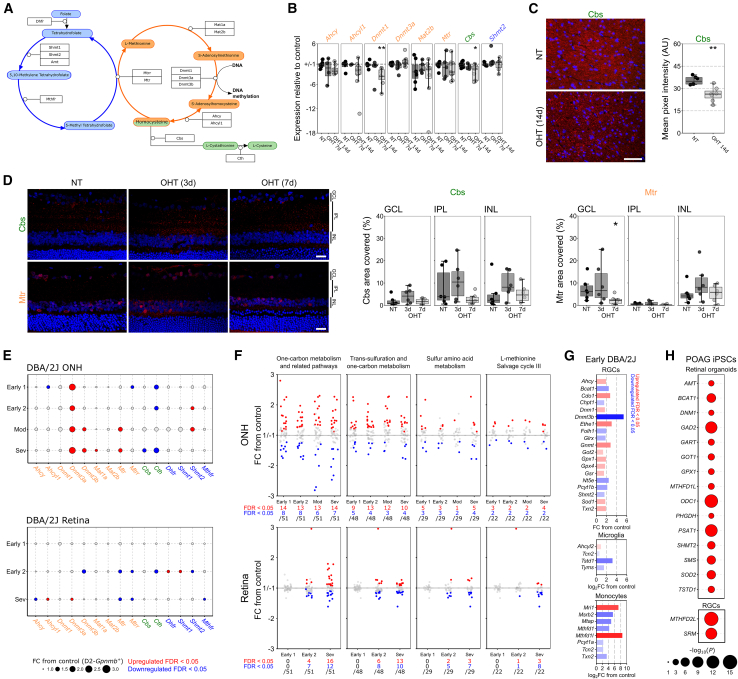
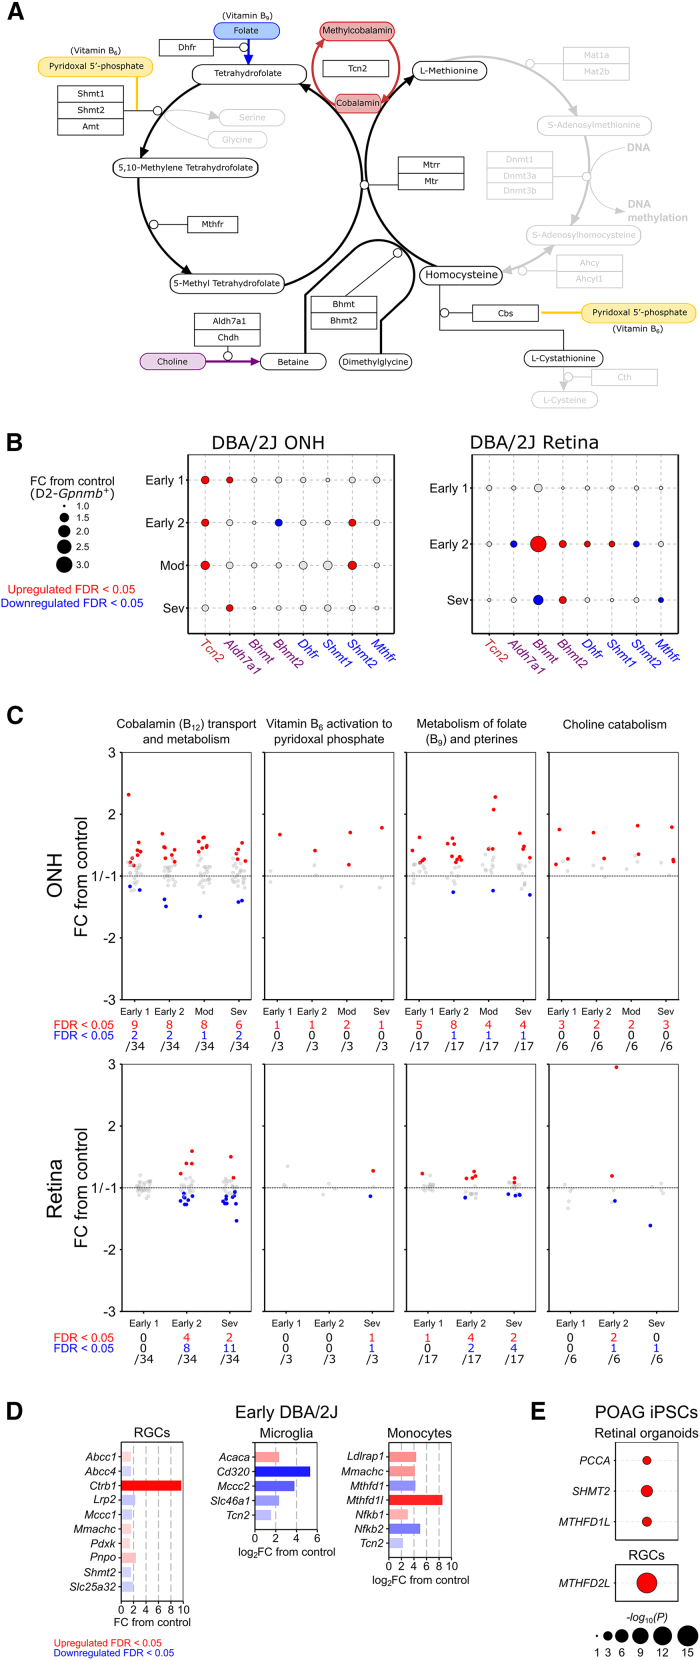
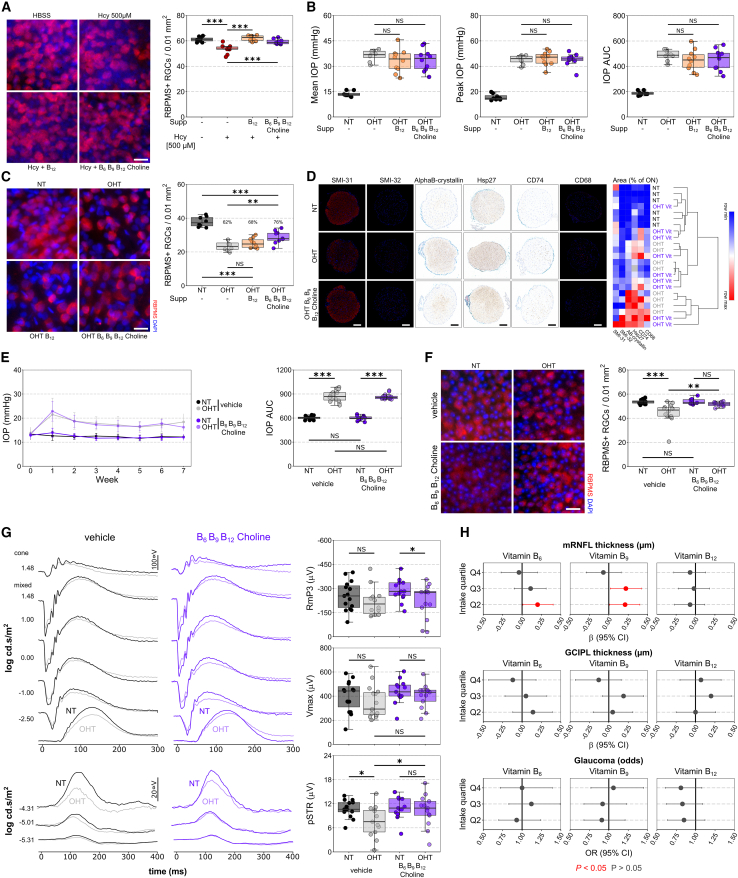
Glaucoma, characterized by the loss of retinal ganglion cells (RGCs), is a leading cause of blindness for which there are no neuroprotective therapies. To explore observations of elevated homocysteine in glaucoma, we elevate vitreous homocysteine, which increases RGC death by 6% following ocular hypertension. Genetic association with higher homocysteine does not affect glaucoma-associated outcomes from the UK Biobank and serum homocysteine levels have no effect on glaucomatous visual field progression. This supports a hypothesis in which elevated homocysteine is a pathogenic, rather than causative, feature of glaucoma. Further exploration of homocysteine metabolism in glaucoma animal models demonstrates early and sustained dysregulation of genes involved in one-carbon metabolism and the interaction of essential cofactors and precursors (B6, B9, B12, and choline) in whole retina and optic nerve head and RGCs. Supplementing these provides neuroprotection in an acute model and prevents neurodegeneration and protects visual function in a chronic model of glaucoma.

Keywords: B vitamin; electroretinogram; homocysteine; neuroprotection; retinal ganglion cell.


Conflict of interest statement

Declaration of interests A.P.K. has acted as a paid consultant or lecturer to AbbVie, Aerie, Allergan, Google Health, Heidelberg Engineering, Novartis, Reichert, Santen, Thea, and Topcon.

Figures

None
Graphical abstract
Figure 1
Figure 1
Elevated homocysteine does not significantly worsen glaucoma (A) Homocysteine is ∼50% higher in the retina of OHT rats at a time point where IOP is high, but there is no detectable neurodegeneration (3 days OHT; data extracted from Tribble et al.; false discovery rate (FDR) < 0.001; n = 8 retina for both conditions). (B) Rats received an intravitreal injection of HBSS or homocysteine (Hcy) 3 days prior to OHT induction. Homocysteine had no effect on IOP in NT or OHT rats over 14 days (NT-HBSS, n = 8 retina; NT-Hcy, n = 7 retina; OHT-HBSS, n = 8 retina; OHT-Hcy, n = 10 retina). (C) Homocysteine had no effect on retinal ganglion cell (RGC) density (RBPMS+) at day 14 in NT animals. RGC density was significantly reduced in OHT-Hcy eyes relative to OHT-HBSS controls. Homocysteine induced a 6% further loss of RGCs relative to HBSS (n as for B). Also see Figures S1A and S1B. (D–H) Fourteen SNPs associated with serum homocysteine (x axis; n = 44,147 people) were compared against the association of the same variants with (D) POAG risk (y axis, n = 216,257 people), (E) macular RNFL, (F) GCIPL thickness (both n = 31,434 people), (G) vertical cup-disc-ratio (vCDR; n = 111,724 people), and (H) IOP (n = 139,555 people) by Mendelian randomization (MR). Across all 4 MR analysis methods (inverse-variance weighted [IVW], weighted median, MR-Egger, and MR-PRESSO), increased homocysteine was not associated with a significant change in any glaucoma and retinal outcome measures (p > 0.05). Also see Tables S1–S4. (I) The correlation between the rate of visual field progression and serum homocysteine levels was calculated in a secondary analysis of the UKGTS using linear mixed models. There were no significant associations of serum homocysteine levels to mean deviation (MD) rate, pointwise sensitivity for all locations (pointwise linear regression, PLR), and the PLR for the fastest 5 locations over time in the whole cohort or when split into placebo and treated groups. Other parameters are relevant to visual field effects as expected (all, n = 147 patients; placebo, n = 73; treatment, n = 74). Also see Figure S1C. Scale bar, 20 μm in (C). ∗p < 0.05, ∗∗p < 0.01, ∗∗∗p < 0.001; NS, p > 0.05. For (A)–(C), the center hinge represents the median with upper and lower hinges representing the first and third quartiles; whiskers represent 1.5 times the interquartile range. For (D)–(I), data are represented as mean and 95% confidence interval (CI).
Figure 2
Figure 2
Dysregulation of one-carbon metabolism is an early and sustained feature of glaucoma (A) Homocysteine is converted to methionine in the methionine cycle (orange) in concert with the folate cycle (blue) or to L-cystathionine in the transsulfuration pathway (green). (B) In the rat optic nerve, ∼50% of the genes encoding the enzymes in these pathways (A) were reliably quantifiable by qPCR, of which expression of Dnmt1 and Cbs was significantly reduced at 14 days post-OHT induction relative to NT control (NT, n = 8 ONs; OHT-d7, n = 6 ONs; OHT-d14, n = 9 ONs). (C) Loss of Cbs in the optic nerve was confirmed by immunofluorescent labeling, with a reduced fluorescent intensity in the optic nerve at 14 days post-OHT induction relative to NT control (NT, n = 6 ONs; OHT-d14, n = 7 ONs). (D) In the retina, Cbs labeling was predominantly located in the inner retina but was unchanged at 3 or 7 days post-OHT induction. Mtr labeling was significantly reduced in the GCL at 7 days post-OHT induction relative to NT control (n = 6 retina for all conditions). Also see Figure S1D. (E) Genes in these pathways are also differentially expressed (red, upregulated; blue, downregulated) in the DBA2/J mouse model of glaucoma (relative to control, D2-Gpnmb+), with an overall upregulation of the methionine cycle in the ONH and downregulation in the retina from early to late disease (for ONH, Early 1 [n = 8], Early 2 [n = 6], Mod [n = 4], and Sev [n = 4] where expression is compared to n = 5 D2-Gpnmb+; in the retina, Early 1 [n = 8], Early 2 [n = 9], and Sev [n = 10]; expression is compared to n = 8 D2-Gpnmb+). (F) Across one-carbon metabolism and related pathways as a whole, significant dysregulation of genes occurs early and is sustained to late disease (n as in E). (G) A number of these genes are differentially expressed in RGCs (from n = 4 DBA/2J; n = 9 D2-Gpnmb+), microglia (from n = 4 DBA/2J; n = 5 D2-Gpnmb+), and infiltrating monocytes (infiltrating ONH monocytes from n = 12 DBA/2J, compared to peripheral blood monocytes from n = 8 D2-Gpnmb+) at the earliest time point. (H) Similarly, in iPSCs from POAG patients, a number one-carbon metabolism-related genes are differentially expressed across pseudotime in the RGC lineage from whole retinal organoids and in final RGC clusters relative to controls (n = 54 POAG; n = 56 control cell lines). Also see Table S5. Scale bar, 50 μm in (C) and 20 μm in (D). For (B)–(D), the center hinge represents the median with upper and lower hinges representing the first and third quartiles; whiskers represent 1.5 times the interquartile range.
Figure 3
Figure 3
Dysregulation of genes related to one-carbon metabolism cofactors occurs in glaucoma (A) The methionine cycle, folate cycle, and transsulfuration pathway require B6 (yellow) and B12 (red) as cofactors, and B9 (blue) and choline (purple) as precursors. (B) Genes in these pathways (encoding proteins which interact with these cofactors and precursors) are differentially expressed (red, upregulated; blue, downregulated) in the DBA2/J mouse model of glaucoma (relative to control, D2-Gpnmb+), and (C) genes involved in the activation, transport, and metabolism of these cofactors and precursors are significantly dysregulated in the ONH and retina across disease stages (for ONH, Early 1 [n = 8], Early 2 [n = 6], Mod [n = 4], and Sev [n = 4] where expression is compared to n = 5 D2-Gpnmb+; in the retina, Early 1 [n = 8], Early 2 [n = 9], and Sev [n = 10]; expression is compared to n = 8 D2-Gpnmb+). (D) This was also evident in RGCs, microglia, and monocytes at the earliest disease point (RGCs from n = 4 DBA/2J and n = 9 D2-Gpnmb+; microglia from n = 4 DBA/2J and n = 5 D2-Gpnmb+; infiltrating ONH monocytes from n = 12 DBA/2J; and peripheral blood monocytes from n = 8 D2-Gpnmb+). (E) Some of these genes are also differentially expressed in iPSC-derived retinal organoids (in the RGC lineage across pseudotime) and RGCs from POAG patients relative to controls (n = 54 POAG; n = 56 control cell lines). Also see Table S5.
Figure 4
Figure 4
Supplementation of vitamin B6, B9, B12, and choline provides structural and functional neuroprotection of retinal ganglion cells (A) Intravitreal injection of a supraphysiological concentration of homocysteine (500 μM) causes significant RGC degeneration (loss of RBPMS+ cells) by 7 days post-injection, which is prevented by 1 week of pre-treatment with either 20 μg/kg/day vitamin B12 only or B12 with 4.5 mg/kg/day vitamin B6, 1.5 mg/kg/day vitamin B9, and 750 mg/kg/d choline (HBSS-vehicle n = 10 retina; Hcy-vehicle n = 10 retina; Hcy-B12n = 8 retina; Hcy-B6/B9/B12/choline n = 8 retina). Also see Figures S2A and S2B. (B and C) (B) The same supplement dose had no effect on IOP over 14 days of OHT in pre-treated rats and (C) provided significant but limited neuroprotection to RGCs (B12 alone had no effect on RGC survival; HT-vehicle n = 8 retina; OHT-vehicle n = 8 retina; OHT-B12n = 10 retina; OHT-B6/B9/B12/choline n = 10 retina). (D) Analysis of optic nerves with markers of RGC axon integrity, stress, and inflammation demonstrated some significant but incomplete protection, as supported by unsupervised hierarchical clustering where 33% of treated nerves clustered with normal controls rather than untreated OHT demonstrating an overall protected profile (no untreated OHT nerves have a profile like NT nerves; HT-vehicle n = 6 ONs; OHT-vehicle n = 8 ONs; OHT-B6/B9/B12/choline n = 9 ONs). Also see Figure S2C. (E and F) (E) In a milder, more chronic mouse model of unilateral OHT (circumlimbal suture), supplementation at the same dose also did not affect IOP and (F) provided complete neuroprotection of RGCs (vehicle n = 15 mice, paired NT and OHT retina; B6/B9/B12/choline-treated n = 15 mice, paired NT and OHT retina). (G) Electrophysiological analysis demonstrated a reduction in RGC-specific function (reduced scotopic threshold response [pSTR] amplitude; n = 15 mice, paired NT-vehicle [black] and OHT-vehicle [gray] retina), which was protected against in supplement-treated mice (n = 13 mice, paired NT-B6/B9/B12/choline [dark purple] and OHT-B6/B9/B12/choline [light purple] retina). Also see Figure S3. (H) Intake of B6, B9, and B12 was quantified from 2 or more dietary recall questionnaires from the UK Biobank and compared to glaucoma-relevant outcomes. Intake of 1.64–1.99 mg of B6 (Q2) or 247.2–302.5 μg (Q2) and 302.5–366.3 μg (Q3) of B9 was associated with significantly thicker mRNFL (p < 0.05, red; p > 0.05, dark gray; for mRNFL, n = 2,907 people for Q1, n = 2,995 for Q2, n = 2,879 for Q3, n = 2,990 for Q4; for GCIPL, n = 2,897 people for Q1, n = 2,995 for Q2, n = 2,880 for Q3, n = 2,979 for Q4; for glaucoma odds, n = 6,677 people for Q1, n = 6,803 for Q2, n = 6,697 for Q3, n = 7,014 for Q4). Also see Table S6. Scale bar, 20 μm in (A), (C), and (F) and 100 μm in (D). For (A)–(G), in the boxplots, the center hinge represents the median with upper and lower hinges representing the first and third quartiles; whiskers represent 1.5 times the interquartile range. For (E), error bars show standard deviation. For (H), data are represented as mean and 95% CI.

References

    1. Tham Y.C., Li X., Wong T.Y., Quigley H.A., Aung T., Cheng C.Y. Global prevalence of glaucoma and projections of glaucoma burden through 2040: a systematic review and meta-analysis. Ophthalmology. 2014;121:2081–2090. - PubMed
    1. Tribble J.R., Hui F., Quintero H., El Hajji S., Bell K., Di Polo A., Williams P.A. Neuroprotection in glaucoma: Mechanisms beyond intraocular pressure lowering. Mol. Aspects Med. 2023;92 - PubMed
    1. Tribble J.R., Vasalauskaite A., Redmond T., Young R.D., Hassan S., Fautsch M.P., Sengpiel F., Williams P.A., Morgan J.E. Midget retinal ganglion cell dendritic and mitochondrial degeneration is an early feature of human glaucoma. Brain Commun. 2019;1 - PMC - PubMed
    1. Quintero H., Shiga Y., Belforte N., Alarcon-Martinez L., El Hajji S., Villafranca-Baughman D., Dotigny F., Di Polo A. Restoration of mitochondria axonal transport by adaptor Disc1 supplementation prevents neurodegeneration and rescues visual function. Cell Rep. 2022;40 - PubMed
    1. Belforte N., Agostinone J., Alarcon-Martinez L., Villafranca-Baughman D., Dotigny F., Cueva Vargas J.L., Di Polo A. AMPK hyperactivation promotes dendrite retraction, synaptic loss, and neuronal dysfunction in glaucoma. Mol. Neurodegener. 2021;16:43. - PMC - PubMed

MeSH terms