. 2025 Jun 23;35(12):2802-2815.e5.
doi: 10.1016/j.cub.2025.04.047. Epub 2025 May 8.

Expression of clock genes tracks daily and tidal time in brains of intertidal crustaceans Eurydice pulchra and Parhyale hawaiensis

Affiliations

Expression of clock genes tracks daily and tidal time in brains of intertidal crustaceans Eurydice pulchra and Parhyale hawaiensis

Andrew Oliphant et al. Curr Biol. .

Abstract

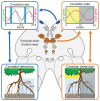
Intertidal organisms, such as the crustaceans Eurydice pulchra and Parhyale hawaiensis, express daily and tidal rhythms of physiology and behavior to adapt to their temporally complex environments. Although the molecular-genetic basis of the circadian clocks driving daily rhythms in terrestrial animals is well understood, the nature of the circatidal clocks driving tidal rhythms remains a mystery. Using in situ hybridization, we identified discrete clusters of ∼60 putative "clock" cells co-expressing canonical circadian clock genes across the protocerebrum of E. pulchra and P. hawaiensis brains. In field-collected, tidally rhythmic E. pulchra sampled under a light:dark (LD) cycle, the expression of period (per) and cryptochrome 2 (cry2) exhibited daily rhythms in particular cell groups, whereas timeless (tim) showed 12-h rhythms in others. In tidally rhythmic laboratory-reared P. hawaiensis, previously entrained to 12.4-h cycles of agitation under LD and sampled under continuous darkness, several cell groups (e.g., medioposterior cells) exhibited circadian expression of per and cry2. In contrast, dorsal-lateral cells in the protocerebrum exhibited robust ∼12-h, i.e., circatidal, rhythms of per and cry2, phased to the prior tidal agitation but not the prior LD. In P. hawaiensis exhibiting daily behavior under LD without tidal agitation, robust daily rhythms of per and cry2 expression were evident in medioposterior and other cells, whereas expression in dorsal-lateral cells was not rhythmic, underlining their essentially tidal periodicity. These results implicate canonical circadian molecules in circatidal timekeeping and reveal conserved brain networks as potential neural substrates for the generation of daily and tidal rhythms appropriate to intertidal habitats.

Keywords: Bmal1; Clock; amphipod; circadian; circatidal; cryptochrome2; isopod; period; protocerebrum; timeless.


Conflict of interest statement

Declaration of interests The authors declare no competing interests.

Figures
Graphical abstract
Graphical abstract
Figure 1
Figure 1. Cellular co-expression of circadian clock genes in the brains of E. pulchra and P. hawaiensis
(A) Representative maximum intensity Z-projections and single optical sections of E. pulchra brain probed for Epper, EpClk, and EpBmal1 using HCR-FISH. Left: merged low-power (25×) view of protocerebrum of E. pulchra, center: merged high-power (40×) single optical sections in boxes labeled 1 and 2, right: single channel high-power maximum intensity Z-projections. EpBmal1 is widely and uniformly expressed in both putative clock cells and other cells across the brain, but it is not enriched in cells enriched for EpClk, whereas Epper is enriched in EpClk-enriched cells. (B) As in (A) for Epper and Epcry2, expression of which is co-enriched in putative clock cells but not in other cells in the brain of E. pulchra. (C) As in (A) for Epper and Eptim, of Epper-enriched cells in E. pulchra. (D) As in (A) but for P. hawaiensis brain probed for PhBmal1, PhClk, and Phcry2 using HCR-FISH. PhBmal1 is widely and uniformly expressed in both putative clock cells and other cells across the brain, but it is not enriched in cells enriched for PhClk, whereas Phcry2 is enriched in PhClk-enriched cells. (E) As in (A) but for P. hawaiensis brain labeled for Phcry2 and Phper. Phcry2 and Phper are co-enriched in putative clock cells, but not other cells, in the brain. Animals were sampled across various points in the light phase of a 14L:10D (E. pulchra) or 12L:12D (P. hawaiensis) cycle in the laboratory without reference to activity rhythms. Scale bars: 100 μm (left-most), 10 μm (other). See also Figures S1–S6 and Table S1.
Figure 2
Figure 2. Putative clock cells in the brains of E. pulchra and P. hawaiensis revealed by co-expression of canonical circadian clock genes
(A) Lateral, frontal, and dorsal views of the E. pulchra reference brain model (from Figure S2A) on to which somata enriched for expression of Epper and Epcry2 are registered and segmented. The neuropils used in Figure S2 to signpost putative clock cells are here made translucent. (B) Diagrammatic representation of the E. pulchra brain summarizing the locations of cells co-enriched for Epper and Epcry2, based on the 3D reconstruction in (A). (C) Lateral, frontal, and dorsal views of the P. hawaiensis reference brain model (from Figure S2C) on to which somata enriched for expression of Phper and Phcry2 are registered and segmented. The neuropils used in Figure S2 to signpost putative clock cells are here made translucent. (D) Diagrammatic representation of the P. hawaiensis brain summarizing the locations of cells co-enriched for Phper and Phcry2 based on the 3D reconstruction in (C). Compass markers in (A) and (C) show anterior (a), posterior (p), dorsal (d), and ventral (v) directions. Discrete cell groups are color coded (see key). Cell numbers within each group (per hemisphere) in parenthesis. Scale bars: 100 μm. See also Figures S1–S6, Table S1, and Videos S1 and S2.
Figure 3
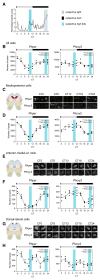
Figure 3. Time course of expression of per, cry2, and tim in cells of tidally rhythmic E. pulchra held on a LD cycle
(A) Normalized swimming activity (mean + SEM, shading) of beach-collected E. pulchra harvested under LD (16L:8D) for the HCR-FISH time course (initial group size at start of harvest at ZT7 = 65). See also Figure S7. (B) Mean aggregate transcript abundance, quantified as the number of FISH spots, of Epper, Epcry2, and Eptim across all cells plotted across time in beach-collected animals held under LD. (C) Left: cartoon to show location of medioposterior cell group in the brain. Right: representative maximum intensity Z-projections of Epper, Epcry2, and Eptim expression in both hemispheres (L: left, R: right) across ZT (individual HCR-FISH channels in rows). Scale bars: 20 μm. (D) Mean transcript abundance, quantified as the number of FISH spots, of Epper and Epcry2 in medioposterior cell group plotted across time in beach-collected animals held under LD. (E and F) As (C) and (D) but for medial cells group. Yellow dashed lines: midlines. Scale bars: 10 μm. Each point is from one brain, total across hemispheres. n = 3–5, N = 55. Inset text indicates statistical tests (JTK-cycle and RAIN) performed to determine 24- and 12-h rhythmicity, with the tested periods in parentheses, following significant time effect by ANOVA or Kruskal-Wallis. ***p < 0.001, **p < 0.01, *p ≤ 0.05, nsp > 0.05. See also Figure S8 for clock gene expression in lateroposterior cell group. For statistics and data shown in this figure, refer to Table S2. See also Figure S15 and Table S10.
Figure 4
Figure 4. Free-running clock gene expression rhythms in tidally entrained P. hawaiensis (tidal phase θ)
(A) Normalized swimming activity (mean + SEM, shading) of P. hawaiensis synchronized to the prior agitation cycle and harvested for the HCR-FISH time course (initial group size at start of harvest at CT0 = 37). (B) Mean aggregate transcript abundance, quantified as the number of FISH spots, of Phper and Phcry2 across all putative clock cells plotted across time in tidally entrained animals sampled under DD. n = 3–4, N = 31. (C) Left: cartoon to show location of medioposterior cell group in the brain. Right: representative maximum intensity Z-projections of Phper and Phcry2 expression in both hemispheres (yellow dashed lines: midlines) across CT (individual HCR-FISH channels in rows). (D) Plots of mean transcript abundance, quantified as the number of FISH spots, across CT for Phper (left) and Phcry2 (right). n = 3–4, N = 33. (E and F) As in (C) and (D) for anterior-medial a1 cells. n = 3–4, N = 34. L, left; R, right. (G and H) As in (C) and (D) for dorsal-lateral cells. n = 3–4, N = 34. L, left; R, right. Each point is from one brain, total across hemispheres. Inset text indicates statistical tests (JTK-cycle and RAIN) performed to determine 24- and 12-h rhythmicity, with the tested periods in parentheses, following significant time effect by ANOVA or Kruskal-Wallis. ***p < 0.001, **p < 0.01, *p ≤ 0.05, nsp > 0.05. For statistics shown in this figure, refer to Table S3. Scale bars: 10 μm (C), 5 μm (E and G). See also Figures S9 and S15 and Tables S7 and S10.
Figure 5
Figure 5. Circatidal rhythms of expression of Phper and Phcry2 in dorsal-lateral cells in the brain of tidally entrained P. hawaiensis
(A) Normalized swimming activity (mean + SEM, shading) of P. hawaiensis synchronized to the prior agitation cycle, phase-shifted by +1.2 h (left) or –5.4 h (right) and harvested for the HCR-FISH time course (initial group sizes at start of harvest at CT0 = 35). (B) Left: cartoon to show location of dorsal-lateral cell group in the brain. Right: representative maximum intensity Z-projections of Phper and Phcry2 in both hemispheres (L, left; R, right) across CT (individual HCR-FISH channels in rows). Scale bars: 5 μm. (C) Plots of mean transcript abundance, quantified as the number of FISH spots, across CT for Phper (left) and Phcry2 (right) (blue shadings: subjective high water). n = 2–4, N = 29. (D and E) As in (B) and (C) for animals entrained to a tidal cycle advanced, relative to the LD cycle, by 5.4 h. n = 2–5, N = 27. Each point is from one brain, total across hemispheres. Inset text indicates statistical tests (JTK-cycle and RAIN) performed to determine 24- and 12-h rhythmicity, with the tested periods in parentheses, following significant time effect by ANOVA or Kruskal-Wallis. ***p < 0.001, **p < 0.01, *p ≤ 0.05, nsp > 0.05. For statistics and data of FISH time course experiments on tidally entrained animals, refer to Tables S4 and S5 for tidal phases θ + 1.2 and θ − 5.4 h, respectively. See also Figures S10, S11, S12, and S15 and Tables S7 and S10.
Figure 6
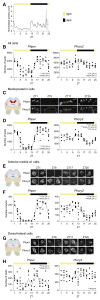
Figure 6. Time course of expression of per and cry2 in cells of P. hawaiensis synchronized to the LD cycle
(A) Normalized swimming activity (mean + SEM, shading) of P. hawaiensis synchronized to the LD cycle and harvested for the HCR-FISH time course (initial group size at start of harvest at ZT1 = 79). (B) Mean aggregate transcript abundance, quantified as the number of FISH spots, of Phper and Phcry2 across all cells plotted across time in animals entrained to, and sampled under, a 12 h:12 h LD cycle. n = 4–6, N = 66. (C) Left: cartoon to show location of medioposterior cell group in the brain. Right: representative maximum intensity Z-projections of Phper and Phcry2 expression in both hemispheres (yellow dashed lines: midlines) across ZT (individual HCR-FISH channels in rows). (D) Plots of mean transcript abundance, quantified as the number of FISH spots, across daily time for Phper (left) and Phcry2 (right). n = 4–6, N = 66. (E and F) As for (C) and (D) for anterior-medial 1a cells. n = 4–6, N = 66. L, left; R, right. (G and H) As for (C) and (D) for dorsal-lateral cells. n = 4–6, N = 66. Each point is from one brain, totaled across hemispheres. Inset text indicates statistical tests (JTK-cycle and RAIN) performed to determine 24- and 12-h rhythmicity, with the tested periods in parentheses, following significant time effect by ANOVA or Kruskal-Wallis. ***p < 0.001, **p < 0.01, *p ≤ 0.05, nsp > 0.05. See also Figure S14 for other cell groups with 24-h cycling in clock gene expression. For statistics and data shown in this figure, refer to Table S6. Scale bars: 10 μm (C), 5 μm (E and G). See also Figures S13 and S15 and Table S10.
Figure 7
Figure 7. Summary meta-analysis of circatidal and circadian rhythms of clock gene expression in medioposterior, anterior-medial a1, and dorsal-lateral cell groups of P. hawaiensis
(A) Left: cartoon to show location of the medioposterior cell group in the brain. Right: scatter-plot of expression of Phper (left) and Phcry2 (right) across three independent experiments registered to subjective CT (CT = 0). Red lines indicate 24-h cosinor fits. (B) As in (A) for anterior-medial a 1 cell group. (C) As in (A) for dorsal-lateral cell group, but plots are registered to subjective high tide (circatidal time [CTT] = 0). Red lines indicate 12.4-h cosinor fits. Inset text in (A)–(C) indicate statistical significance of cosinor. (D) Circular plot of circadian peak expression phase of Phper and Phcry2 in selected rhythmic cell groups of P. hawaiensis exhibiting circatidal activity rhythms. Each color-shape combination represents data from across N = 3 experiments. Arrowed lines indicate mean phase for each gene-cell group combination, and length of arrowed lines indicates the power of the vector at each mean. (E) Circular plots of circatidal peak expression phase of Phper and Phcry2 in the dorsal-lateral cells of P. hawaiensis exhibiting circatidal activity rhythms, with the circatidal acrophase aligned to CTT0 within each individual experiment. Arrowed lines indicate mean phase for each gene-cell group combination, and length of arrowed lines indicates the power of the vector at each mean. For mean phase and mean vector lengths for each gene-cell group combination in (D) and (E), see Table S7.

References

    1. Dunlap JC, Loros JJ, Decoursey PJ. Chronobiology: Biological Timekeeping. Sinauer; 2004.
    1. Naylor E. Chronobiology of Marine Organisms. Cambridge University Press; 2010. - DOI
    1. Häfker NS, Andreatta G, Manzotti A, Falciatore A, Raible F, Tessmar-Raible K. Rhythms and Clocks in Marine Organisms. Ann Rev Mar Sci. 2023;15:509–538. - PubMed
    1. Enright JT. Plasticity in an isopod’s clockworks: shaking shapes form and affects phase and frequency. J Comp Physiol. 1976;107:13–37. doi: 10.1007/BF00663916. - DOI
    1. Palmer JD. Review of the dual-clock control of tidal rhythms and the hypothesis that the same clock governs both circatidal and circadian rhythms. Chronobiol Int. 1995;12:299–310. doi: 10.3109/07420529509057279. - DOI

Substances

LinkOut - more resources