

Left ventricular flow kinetics and myocardial deformation following acute infarction: Additional predictive value of cardiac magnetic resonance four-dimensional flow for left ventricular remodeling post-ST-elevation myocardial infarction
- PMID: 40345668
- PMCID: PMC12173736
- DOI: 10.1016/j.jocmr.2025.101905
Left ventricular flow kinetics and myocardial deformation following acute infarction: Additional predictive value of cardiac magnetic resonance four-dimensional flow for left ventricular remodeling post-ST-elevation myocardial infarction
Abstract
Background: The exact mechanism underlying myocardial maladaptive changes post ST-elevation myocardial infarction (STEMI) remains unclear. We sought to assess the impact of the tissue=flow interaction on the development of adverse cardiac remodeling 12 months(M) after acute STEMI.
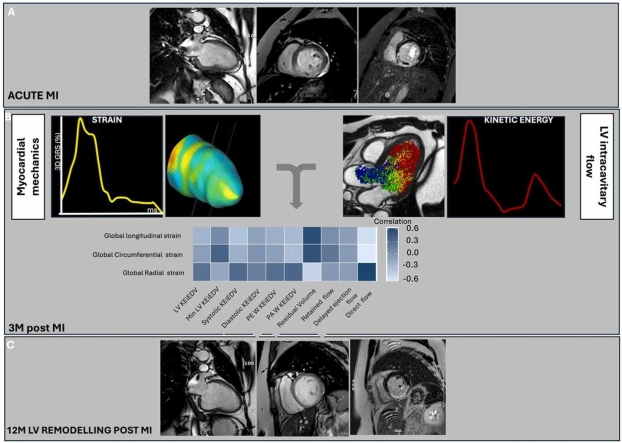
Materials and methods: Forty-nine first-STEMI patients (M:F = 26:13; mean age = 58 ± 10) prospectively underwent 3T cardiovascular magnetic resonance (CMR) acutely, at 3 months (3M) and 12M post-STEMI. The CMR protocol included left ventricular (LV) cine-images for LV end-diastolic (LVEDV) and end-systolic volumes, stroke volume (SV), and ejection fraction (LVEF); four-dimensional (4D)-flow and late gadolinium enhancement imaging. The 3M outcome measures included 4D-flow derived LV flow kinetic energy indexed to EDV (KEiEDV) and functional flow components [LV-KEiEDV, minimal- KEiEDV, diastolic- KEiEDV, and residual volume (RV), retained inflow, delayed ejection, direct flow (DF)]; global radial, circumferential, and longitudinal strain (GRS, GCS, GLS) by feature tracking (FT); infarct size (IS). Adverse LV remodeling (LVremod) was defined by a ≥20% increase in LVEDVi at 12M from baseline, in opposition to the non-remodeling group (LVnon-remod). Association between SV, FT-strain, KE, and 4D flow parameters was assessed, as well as predictors of adverse remodeling at 12M post-STEMI.
Results: There were 23 LVremod patients. At 3M post-STEMI, LVremod patients had significantly reduced LVEF, increased IS, abnormal FT-strain, systolic KEiEDV, DF, and RV compared to LVnon-remod patients. There was no significant difference in SV between the two groups. FT-strain parameters significantly correlated with DF (GRS: r = 0.62; GCS: r = -0.67; GLS: r = -0.58, all p < 0.001); RV (GRS: r = -0.56; GCS: r = 0.51; GLS: r = 0.53, all p < 0.001); peak-A-wave KEiEDV (GRS: r = 0.38, p = 0.008; GCS: r = -0.30, p = 0.038; GLS: r = -0.29, p = 0.04); systolic KEiEDV (GRS: r = 0.31, p = 0.033, GLS: r = -0.35, p = 0.012). DF outperformed conventional LV function parameters (SV and LVEF) in the LVremod prediction. DF and IS were the only independent predictors of 12M adverse remodeling after adjustment for LVEF, SV, FT-strain, and KEiEDV parameters.
Conclusions: Our study suggests a potential early interaction between FT-strain and 4D-flow parameters post-STEMI leading to the development of adverse remodeling. Within the limitations of our sample size, DF and IS were independent predictors of LV remodeling after adjustment for LVEF, SV, FT-strain, and KE parameters. These findings suggest that these parameters may contribute to further risk stratification at 3M for the development of adverse remodeling at 12M post-STEMI, above conventional LV function parameters. Larger studies are needed to confirm these results.
Keywords: 4D flow parameters; CMR post MI; Global FT strain parameters; Interaction of FT strain and 4D flow parameters; Prediction of LV adverse remodeling at 12 months post STEMI.
Copyright © 2025 The Authors. Published by Elsevier Inc. All rights reserved.
Conflict of interest statement
Declaration of competing interests The authors declare that they have no known competing financial interests or personal relationships that could have appeared to influence the work reported in this paper.
Figures


Similar articles
-
Age- and sex-specific reference values of biventricular flow components and kinetic energy by 4D flow cardiovascular magnetic resonance in healthy subjects.J Cardiovasc Magn Reson. 2023 Sep 18;25(1):50. doi: 10.1186/s12968-023-00960-x. J Cardiovasc Magn Reson. 2023. PMID: 37718441 Free PMC article.
-
Value of high-density lipoprotein cholesterol, myocardial perfusion index, and global longitudinal strain derived from cardiac magnetic resonance imaging in predicting coronary slow flow in patients with nonobstructive coronary artery disease.Quant Imaging Med Surg. 2025 Sep 1;15(9):8491-8504. doi: 10.21037/qims-24-1668. Epub 2025 Aug 11. Quant Imaging Med Surg. 2025. PMID: 40893499 Free PMC article.
-
Prognostic value of myocardial deformation parameters for outcome prediction in tetralogy of Fallot.J Cardiovasc Magn Reson. 2024 Winter;26(2):101054. doi: 10.1016/j.jocmr.2024.101054. Epub 2024 Jul 1. J Cardiovasc Magn Reson. 2024. PMID: 38960284 Free PMC article.
-
Definition of left ventricular remodelling following ST-elevation myocardial infarction: a systematic review of cardiac magnetic resonance studies in the past decade.Heart Fail Rev. 2022 Jan;27(1):37-48. doi: 10.1007/s10741-020-09975-3. Heart Fail Rev. 2022. PMID: 32458217
-
Magnetic Resonance Imaging of Myocardial Strain After Acute ST-Segment-Elevation Myocardial Infarction: A Systematic Review.Circ Cardiovasc Imaging. 2017 Aug;10(8):e006498. doi: 10.1161/CIRCIMAGING.117.006498. Circ Cardiovasc Imaging. 2017. PMID: 28733364
References
-
- Hsu E.W., Muzikant A.L., Matulevicius S.A., Penland R.C., Henriquez C.S. Magnetic resonance myocardial fiber-orientation mapping with direct histological correlation. Am J Physiol. 1998;274(5):H1627–H1634. - PubMed
-
- Mangion K., McComb C., Auger D.A., Epstein F.H., Berry C. Magnetic resonance imaging of myocardial strain after acute ST-segment–elevation myocardial infarction. Circ: Cardiovasc Imaging. 2017;10(8) - PubMed
-
- Dall'Armellina E., Karia N., Lindsay A.C., Karamitsos T.D., Ferreira V., Robson M.D., et al. Dynamic changes of edema and late gadolinium enhancement after acute myocardial infarction and their relationship to functional recovery and salvage index. Circ: Cardiovasc Imaging. 2011;4(3):228–236. - PMC - PubMed
-
- Ben-Arzi H., Das A., Kelly C., van der Geest R.J., Plein S., Dall'Armellina E. Longitudinal changes in left ventricular blood flow kinetic energy after myocardial infarction: predictive relevance for cardiac remodeling. J Magn Reson Imaging. 2022;56(3):768–778. - PubMed
LinkOut - more resources
Full Text Sources
Miscellaneous
