. 2025 Jun 12;12(6):ENEURO.0113-25.2025.
doi: 10.1523/ENEURO.0113-25.2025. Print 2025 Jun.

Demyelination Produces a Shift in the Population of Cortical Neurons That Synapse with Callosal Oligodendrocyte Progenitor Cells

Affiliations

Demyelination Produces a Shift in the Population of Cortical Neurons That Synapse with Callosal Oligodendrocyte Progenitor Cells

Benjamin S Summers et al. eNeuro. .

Abstract

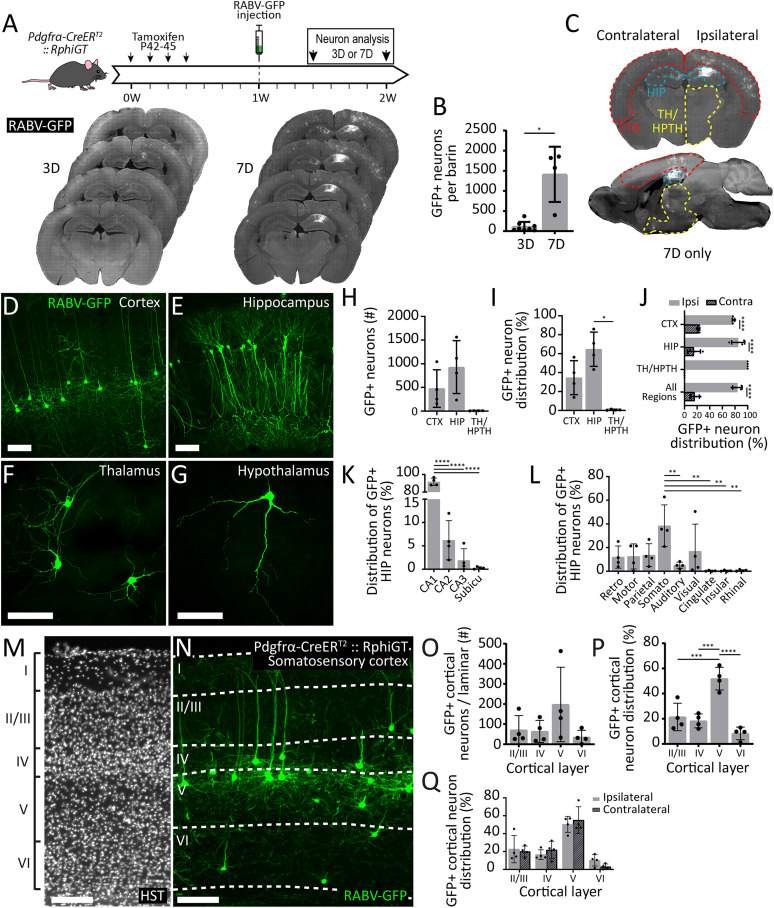
Oligodendrocyte progenitor cells (OPCs) receive synaptic input from a diverse range of neurons in the developing and adult brain. Understanding whether the neuronal populations that synapse with OPCs in the healthy brain is altered by demyelination and/or remyelination may support the advancement of neuroprotective or myelin repair strategies being developed for demyelinating diseases such as multiple sclerosis. To explore this possibility, we employed cre-lox transgenic technology to facilitate the infection of OPCs by a modified rabies virus, enabling the retrograde monosynaptic tracing of neuron→OPC connectivity. In the healthy adult mouse, OPCs in the corpus callosum primarily received synaptic input from ipsilateral cortical neurons. Of the cortical neurons, ∼50% were layer V pyramidal cells. Cuprizone demyelination reduced the total number of labeled neurons. However, the frequency/kinetics of mini-excitatory postsynaptic currents recorded from OPCs appeared preserved. Of particular interest, demyelination increased the number of labeled layer II/III pyramidal neurons and also increased at the expense of layer V pyramidal neurons, a change that was largely ameliorated by remyelination. These data suggest that in the healthy adult mouse brain, callosal OPCs primarily receive synaptic input from cortical layer V pyramidal neurons. However, callosal demyelination is associated with a population switch and OPCs equally synapse with layer II/III and V pyramidal neurons to synapse with OPCs, until myelin is restored.

Keywords: NG2 glia; demyelination; oligodendrocyte progenitor cells; rabies virus; remyelination; synapse.


Conflict of interest statement

The authors declare no competing financial interests.

Figures

None
Visual Abstract
Figure 1.
Figure 1.
RABV-GFP+ OPCs are located in the corpus callosum, cortex, and hippocampus of Pdgfrα-CreERT2 :: RphiGT transgenic mice. A, Experimental time-course schematic. Pdgfrα-CreERT2 :: RphiGT transgenic mice received tamoxifen from P42–45 and were injected with the SADΔG-GFP-(EnvA) virus at P49. Labeled RABV-GFP+ OPCs were visualized 1, 2, 3, 4, 5, and 7 d postinjection. B–J, Representative compressed confocal images of RABV-GFP+ (green) PDGFRα+ (red) OPCs, with Hoechst 33342 labeled nuclei (HST; blue), in the cortex (CTX; AC), corpus callosum (CC; D–F), and hippocampus (HIP; G–I) of adult Pdgfrα-CreERT2 :: RphiGT transgenic mice injected with the SADΔG-GFP-(EnvA) virus. Scale bars represent 20 µm. K, The proportion of RABV-GFP+ OPCs within the CTX, CC, and HIP of individual Pdgfrα-CreERT2 :: RphiGT transgenic mice (n = 19). One-way ANOVA F(2,54) = 79.93, p < 0.0001; data were square root transformed for analysis to satisfy the assumptions of normality and homoscedasticity of the variances. K, Quantification of the total number of RABV-GFP+ OPCs in Pdgfrα-CreERT2 :: RphiGT nice (n = 24) at 1, 2, 3, 4, 5, and 7 days postinjection. One-way ANOVA F(5,18) = 4.051, p = 0.012, linear trend: F(5,18) = 19.20, p = 0.0004, R2 = 0.94. Data were square root transformed for analysis to satisfy the assumptions of normality and homoscedasticity of the variances. Error bars display mean ± SD. *p ≤ 0.05, ****p ≤ 0.0001 by Tukey's multiple-comparison posttest. Extended data Figure 1-1 supports Figure 1.
Figure 2.
Figure 2.
Callosal OPCs primarily receive synaptic input from ipsilateral pyramidal neurons in cortical layer V. A, Experimental time-course schematic and representative compressed confocal image of serial coronal brain sections from Pdgfrα-CreERT2 :: RphiGT transgenic mice 3 and 7 d postinjection (D) of the SADΔG-GFP-(EnvA) virus into the corpus callosum. Images encompass the injection site and display RABV-GFP (white). B, Quantification of the total number of RABV-GFP+ neurons 3 and 7 d after the SADΔG-GFP-(EnvA) virus was delivered into the corpus callosum of P42 + 7 Pdgfrα-CreERT2 :: RphiGT mice (n = 8 at 3 DPI, 4 at 7 DPI; mean ± SD). Welch's t test: t = 4652, df = 3.644, p = 0.012. Data were square root transformed for analysis to satisfy the assumptions of normality and homoscedasticity of the variances. C, Compressed confocal image of RABV-GFP (white) labeling in a coronal and sagittal brain section from a P42 + 7 Pdgfrα-CreERT2 :: RphiGT transgenic mouse, 7 d postinjection of the SADΔG-GFP-(EnvA) virus into the corpus callosum. The cortex (CTX; red), hippocampus (HIP; blue), and thalamus plus hypothalamus (TH/HPTH; yellow) are outlined on the image. D–G, Representative compressed confocal images of RABV-GFP+ (green) neurons in the cortex (D), hippocampus (E), thalamus (F), and hypothalamus (G) 7 d after injecting the SADΔG-GFP-(EnvA) virus into the corpus callous of P42 + 7 Pdgfrα-CreERT2:: RphiGT transgenic mice. H, Quantification of the total number of RABV-GFP+ neurons in the CTX, HIP, and TH/HPTH of each Pdgfrα-CreERT2 :: RphiGT transgenic mouse (n = 4). Welch's ANOVA: F(2,4) = 7.096, p = 0.0483. I, The proportion of RABV-GFP+ neurons in the CTX, HIP, and TH/HPTH of each Pdgfrα-CreERT2 :: RphiGT transgenic mouse (n = 4). Welch's ANOVA: F(2,4.009) = 27.550, p = 0.005. J, The proportion of ipsilateral and contralateral RABV-GFP+ neurons within the whole brain, CTX, HIP, and TH/HPTH of Pdgfrα-CreERT2 :: RphiGT transgenic mice (n = 4). Two-way ANOVA: interaction F(2,18) = 2.301, p = 0.129; region F(2,18) = 3.670 × 10−10, p > 0.999; hemisphere F(1,18) = 447.4, p < 0.0001. K, The proportion of hippocampal RABV-GFP+ neurons identified in hippocampal subregions of individual Pdgfrα-CreERT2 :: RphiGT transgenic mice (n = 4). One-way ANOVA: F(3,12) = 759.3, p < 0.0001. L, The proportion of cortical RABV-GFP+ neurons identified in each cortical region of individual Pdgfrα-CreERT2:: RphiGT transgenic mice (n = 4). One-way ANOVA: F(8,27) = 4.642, p = 0.001. M, Compressed confocal image of the cortex in which Hoechst 33342 nuclear stain (HST; white) was used to identify each cortical layer (I, II/III, IV, V, and VI). N, Compressed confocal image of the somatosensory cortex of a P42 + 14 Pdgfrα-CreERT2 :: RphiGT transgenic mouse 7 d postinjection of the SADΔG-GFP-(EnvA) virus into the corpus callosum, showing RABV-GFP+ (green) cortical neurons distributed across the cortical laminar. O, Quantification of the total number of RABV-GFP+ cortical neurons in cortical layers II/III, IV, V, and VI of individual Pdgfrα-CreERT2 :: RphiGT transgenic mice (n = 4). One-way ANOVA: F(3,12) = 1.904, p = 0.183. P, The proportion of RABV-GFP+ cortical neurons in cortical layers II/III, IV, V, and VI of individual Pdgfrα-CreERT2 :: RphiGT transgenic mice (n = 4). One-way ANOVA: F(3,12) = 21.99, p < 0.0001. Q, The proportion of ipsilateral and contralateral RABV-GFP+ cortical neurons within cortical layers II/III, IV, V, and VI, in individual Pdgfrα-CreERT2 :: RphiGT transgenic mice (n = 4). Two-way ANOVA: interaction F(3,24) = 0.772, p = 0.521; laminar F(3,24) = 33.13, p < 0.0001; and hemisphere F(1,24) = 2.839 × 10−5, p = 0.996. Data are expressed as mean ± SD. Closed circles represent individual animals. Scale bars represent 100 µm (D–G and M, N). *p ≤ 0.05, **p ≤ 0.01, ***p ≤ 0.001, ****p ≤ 0.0001 by Dunnett's T3 (I) or Tukey's (J–L and P) multiple-comparison posttest. Extended Data Figure 2-1 supports Figure 2.
Figure 3.
Figure 3.
Cuprizone induces reversible demyelination of the corpus callosum and alters the distribution but not the number of RABV-GFP+ OPCs. A, Experimental time-course schematic. C57BL/6 control mice were retained on normal chow and tissue collected at P84. Demyelinated mice received 0.2% (w/w) cuprizone chow from P49 and tissue was collected at P84. Remyelinating mice received 0.2% (w/w) cuprizone chow P49–P84 and were returned to normal chow until tissue was collected at P119. B–D, Confocal images of the medial corpus callosum (CC) in coronal brain sections immunolabeled to detect MBP (white), taken from a control (A), demyelinated (B), and remyelinating (C) adult C57bL/6 mice. E, Quantification of the area of the medial CC labeled for MBP in individual control, demyelinated, and remyelinating C57bL/6 mice (n = 5 per group; mean ± SD). One-way ANOVA: F(2,12) = 78.92, p < 0.0001. F, Experimental time-course schematic. Pdgfrα-CreERT2 :: RphiGT mice received tamoxifen from P42–45. Control mice were retained on control diet for the duration of the experiment. Demyelinated mice were transferred to 0.2% (w/w) cuprizone chow from P49 to P84. All mice were on a normal diet and received the SADΔG-GFP-(EnvA) virus at P85. RABV-GFP+ OPCs were analyzed at P87 (3D). G–H, Compressed confocal image of coronal brain section from a control (A) or cuprizone demyelinated (B) adult Pdgfrα-CreERT2 :: RphiGT transgenic mice 3D after the SADΔG-GFP-(EnvA) virus (white) was injected into the corpus callosum (CC). The cortex (CTX), CC, hippocampus (HIP), and the location of viral microinjection (marked “X”) are indicated on the images. I, Quantification of the total number of RABV-GFP+ PDGFRα+ OPCs per control or demyelinated Pdgfrα-CreERT2 :: RphiGT SADΔG-GFP-(EnvA) injected transgenic mouse (n = 5 per group). Unpaired t test: t = 0.678, p = 0.517. J, The proportion of RABV-GFP+ OPCs located in the CTX, CC, and HIP in control or demyelinated Pdgfrα-CreERT2 :: RphiGT transgenic mice (n = 5 per group). Two-way ANOVA: region × treatment F(2,24) = 0.715, p = 0.499; region F(2,24) = 18.63, p < 0.0001; treatment F(1,24) = 0.286, p = 0.597. Data were square root transformed for analysis to satisfy the assumptions of normality and homoscedasticity of the variances. K, The distance (mm) of individual callosal and hippocampal RABV-GFP+ OPCs from the site of viral microinjection on the medial-lateral axis within control (n = 35 RABV-GFP+ OPCs) or demyelinated (n = 25 RABV-GFP+ OPCs) Pdgfrα-CreERT2 :: RphiGT transgenic mice (n = 5 mice per group). KS test, p = 0.0021. L, The mean distance (mm) of each RABV-GFP+ OPC from the site of viral microinjection along the medial-lateral axis, per control or demyelinated Pdgfrα-CreERT2 :: RphiGT transgenic mouse (n = 5 per group). Welch's t test: t = 2.052, df = 4.503, p = 0.102. M, The distance (mm) of individual callosal and hippocampal RABV-GFP+ OPCs from the site of viral microinjection on the rostral-caudal axis within control (n = 35 RABV-GFP+ OPCs) or demyelinated (n = 25 RABV-GFP+ OPCs) Pdgfrα-CreERT2 :: RphiGT transgenic mice cohorts (n = 5 mice per group). KS test, p = 0.0002. N, The mean distance (mm) of each RABV-GFP+ OPC from the site of viral microinjection along the rostral-caudal axis, in control or demyelinated Pdgfrα-CreERT2 :: RphiGT transgenic mouse (n = 5 per group). Welch's t test: t = 1.22, df = 7.617, p = 0.25. Data are expressed as mean ± SD. Closed circles represent individual animals (E, I–L, N), or individual OPCs (K,M). Scale bars represent 100 µm (B–D) or 500 µm (G–H). **p ≤ 0.01, ***p ≤ 0.001, ****p ≤ 0.0001 by Tukey's multiple-comparison posttest (E, J).
Figure 4.
Figure 4.
The number of RABV-GFP+ neurons detected in Pdgfrα-CreERT2:: RphiGT transgenic mice decreases following cuprizone demyelination. A, Quantification of the total number of RABV-GFP+ neurons in Pdgfrα-CreERT2 :: RphiGT transgenic mice 7D after callosal injection with the SADΔG-GFP-(EnvA) virus in control, demyelinated or remyelinating mice (n ≥ 5 per group). One-way ANOVA: F(2,16) = 9.486, p = 0.0019; with Tukey's posttest. Data were square root transformed for analysis to satisfy the assumptions of normality and homoscedasticity of the variances. B, Representative traces of voltage-gated sodium currents evoked by a depolarizing step from −70 to 0 mV recorded from GFP+ OPCs (in the absence and presence of tetrodotoxin; TTX), newly born OLs (pre-OLs), and mature OLs, in the corpus callosum of acute brain slices generated from P85 Pdgfrα-H2BGFP transgenic mice. C, D, Example traces showing mEPSCs recorded from GFP+ callosal OPCs in acute brain slices generated from P85 Pdgfrα-H2BGFP transgenic mice following 5 weeks of control (C) or cuprizone (0.2% w/w) (D) diet, in the presence of TTX or TTX and the secretagogue ruthenium red (RR). Representative examples of individual ePSCs show the fast rise and decay times. E, H, The frequency of mEPSCs recorded from individual GFP+ callosal OPC of control or demyelinated mice. Recordings were made in the presence of TTX (E; REML, linear mixed effect ANOVA: F(1,9.784) = 0.1211, p = 0.7352) or TTX and RR (H; REML linear mixed effect model: F(1,16) = 0.795, p = 0.3857). F, I, The mean amplitude of mEPSCs recorded in individual callosal OPC of control or demyelinated mice. Recordings were made in the presence of TTX (F: REML, linear mixed effect ANOVA: F(1,7.054) = 0.594, p = 0.465) or TTX and RR (I: REML, linear mixed effect ANOVA: F(1,6.973) = 2.574, p = 0.152). G, J, The mean decay time for mEPSCs recorded in individual callosal OPC of control or demyelinated mice. Recordings were made in the presence of TTX (G: REML, linear mixed effect ANOVA: F(1,8.602) = 3.299, p = 0.2042) or TTX and RR (REML, linear mixed effect ANOVA: F(1,16) = 1.6083, p = 0.222). Data are expressed as mean ± SD. Closed circles represent individual animals (A = 9 control, 4 demyelinated, 6 remyelinating) or individual cells (E–J:6 control and 12 demyelinated OPCs). *p ≤ 0.05, **p ≤ 0.01.
Figure 5.
Figure 5.
In the demyelinated brain callosal OPCs more frequently synapse with ipsilateral cortical neurons. A, Experimental time-course schematic. Pdgfrα-CreERT2 :: RphiGT transgenic mice received tamoxifen from P42–45 and were split into three groups. Control mice received normal chow while demyelinated and remyelinating mice received 0.2% (w/w) cuprizone chow from P49 to P84. Control and demyelinated mice were injected with SADΔG-GFP-(EnvA) virus at P85 and analyzed at P92. Remyelinating mice were injected at P119 and analyzed at P126. B–D, Representative coronal brain sections from control (A), demyelinated (B), and remyelinating (C) adult Pdgfrα-CreERT2 :: RphiGT transgenic mice 7 d postinjection of the SADΔG-GFP-(EnvA) virus (white) into the corpus callosum. E, F, Quantification of the total number of RABV-GFP+ neurons within the cortex of Pdgfrα-CreERT2 :: RphiGT control, demyelinated, and remyelinating mice (E; one-way ANOVA: F(2,16) = 2.283, p = 0.134) and the proportion of RABV-GFP+ neurons that were found within the cortex (F; one-way ANOVA: F(2,16) = 5.38, p = 0.0163; 9 controls, 4 demyelinated, and 6 remyelinating mice). Data were square root transformed for analysis to satisfy the assumptions of normality and homoscedasticity of the variances. G, H, Quantification of the total number of RABV-GFP+ neurons in the hippocampus of Pdgfrα-CreERT2 :: RphiGT control, demyelinated, and remyelinating mice (G; one-way ANOVA: F(2,16) = 13.30, p = 0.0003) and the proportion of neurons located within the hippocampus (H; one-way ANOVA: F(2,16) = 5.971, p = 0.016; 9 controls, 4 demyelinated and 6 remyelinating mice). Data were square root transformed for analysis to satisfy the assumptions of normality and homoscedasticity of the variances. I, J, Quantification of the number of RABV-GFP+ neurons within the contralateral cortex of Pdgfrα-CreERT2 :: RphiGT control, demyelinated, and remyelinating mice (I; one-way ANOVA: F(2,16) = 8.864, p = 0.0026) and the proportion of RABV-GFP+ cortical neurons located within the contralateral hemisphere (J; one-way ANOVA: F(2,16) = 7.49, p = 0.005; 9 controls, 4 demyelinated, and 6 remyelinating mice). Data were square root transformed for analysis to satisfy the assumptions of normality and homoscedasticity of the variances. K, L, Quantification of the number of RABV-GFP+ neurons within the contralateral hippocampus of Pdgfrα-CreERT2 :: RphiGT control, demyelinated, and remyelinating mice (K; one-way ANOVA: F(2,16) = 13.30, p = 0.0003) and the proportion of RABV-GFP+ hippocampal neurons located within the contralateral hemisphere (L; one-way ANOVA: F(2,16) = 1.824, p = 0.19; 9 controls, 4 demyelinated, and 6 remyelinating mice). Data were square root transformed for analysis to satisfy the assumptions of normality and homoscedasticity of the variances. M, The proportion of RABV-GFP+ neurons that were located within the thalamic or hypothalamic nuclei of Pdgfrα-CreERT2 :: RphiGT control, demyelinated, or remyelinating mice (one-way ANOVA: F(2,16) = 0.656, p = 0.53). Data were square root transformed for analysis to satisfy the assumptions of normality and homoscedasticity of the variances. N, The proportion of cortical RABV-GFP+ neurons located in each cortical region of Pdgfrα-CreERT2 :: RphiGT control, demyelinated, or remyelinating mice. Note that cortical regions containing >1% of RABV-GFP+ neurons are shown. Two-way ANOVA: interaction F(12,112) = 2.325, p = 0.0108; region F(6,112) = 13.75, p < 0.0001; treatment F(2,112) = 0.00187, p = 0.9981. O, The proportion of hippocampal RABV-GFP+ neurons within each hippocampal subregion of Pdgfrα-CreERT2 :: RphiGT control, demyelinated, or remyelinating mice. Two-way ANOVA: interaction F(6,60) = 1.042, p = 0.4072; region F(3,60) = 3,289, p < 0.0001, treatment F(2,60) = 0.0677, p = 0.93047. Data are expressed as mean ± SD. *p ≤ 0.05, **p ≤ 0.01, ****p ≤ 0.0001 by Tukey's multiple-comparison posttest.
Figure 6.
Figure 6.
In the demyelinated brain, OPCs receive fewer synapses from layer V and more from layer II/III. AC, Compressed confocal images of the cortex of control (A), demyelinated (B), and remyelinating (C) adult Pdgfrα-CreERT2 :: RphiGT transgenic mice, 7 d after the SADΔG-GFP-(EnvA) virus was injected into the corpus callosum, showing RABV-GFP+ (green) cortical neurons distributed across cortical layers I, II/III, IV, V, and VI. Scale bars represent 100 µm. D, E, The total number (2-way ANOVA: interaction F(6,64) = 1.945, p = 0.087; laminar F(3,64) = 4.196, p = 0.009; treatment F(2,64) = 8.276, p = 0.001) of RABV-GFP+ cortical neurons positioned in layers II/III, IV, V, and VI of Pdgfrα-CreERT2:: RphiGT control, demyelinated, or remyelinating mice (9 controls, 4 demyelinated, and 6 remyelinating mice) and the proportion of RABV-GFP+ cortical neurons in each laminar (2-way ANOVA: interaction F(6,64) = 3.354, p = 0.006; laminar F(3,64) = 59.97, p < 0.0001; treatment F(2,64) = 0.0005, p = 0.9995). F–H, Data from E, displaying post hoc analysis of the proportion of RABV-GFP+ cortical neurons in cortical laminar II/III, IV, V, and VI of Pdgfrα-CreERT2 :: RphiGT control (F), demyelinated (G), or remyelinating (H) mice. Data are expressed as mean ± SD. *p ≤ 0.05, **p ≤ 0.01, ***p ≤ 0.001, ****p ≤ 0.0001 by Tukey's multiple-comparisons posttest. Extended Data Figure 6-1 supports Figure 6.

Similar articles

References

    1. Balia M, Benamer N, Angulo MC (2017) A specific GABAergic synapse onto oligodendrocyte precursors does not regulate cortical oligodendrogenesis. Glia 65:1821–1832. 10.1002/glia.23197 - DOI - PubMed
    1. Battefeld A, Popovic MA, de Vries SI, Kole MHP (2019) High-frequency microdomain Ca(2+) transients and waves during early myelin internode remodeling. Cell Rep 26:182–191.e5. 10.1016/j.celrep.2018.12.039 - DOI - PMC - PubMed
    1. Bergles DE, Roberts JD, Somogyi P, Jahr CE (2000) Glutamatergic synapses on oligodendrocyte precursor cells in the hippocampus. Nature 405:187–191. 10.1038/35012083 - DOI - PubMed
    1. Buchanan J, da Costa NM, Cheadle L (2023) Emerging roles of oligodendrocyte precursor cells in neural circuit development and remodeling. Trends Neurosci 46:628–639. 10.1016/j.tins.2023.05.007 - DOI - PMC - PubMed
    1. Call CL, Bergles DE (2021) Cortical neurons exhibit diverse myelination patterns that scale between mouse brain regions and regenerate after demyelination. Nat Commun 12:4767. 10.1038/s41467-021-25035-2 - DOI - PMC - PubMed

MeSH terms

LinkOut - more resources