. 2025 May;13(9):e70348.
doi: 10.14814/phy2.70348.

Therapeutic hyperthermia promotes lipid export and HSP70/90 during machine perfusion of human livers

Affiliations

Therapeutic hyperthermia promotes lipid export and HSP70/90 during machine perfusion of human livers

Adam M Thorne et al. Physiol Rep. 2025 May.

Abstract

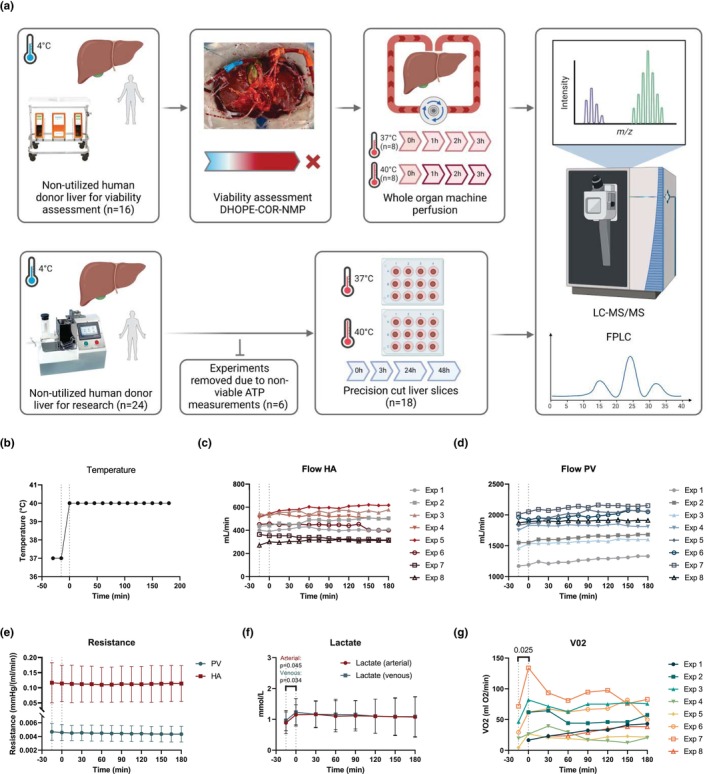
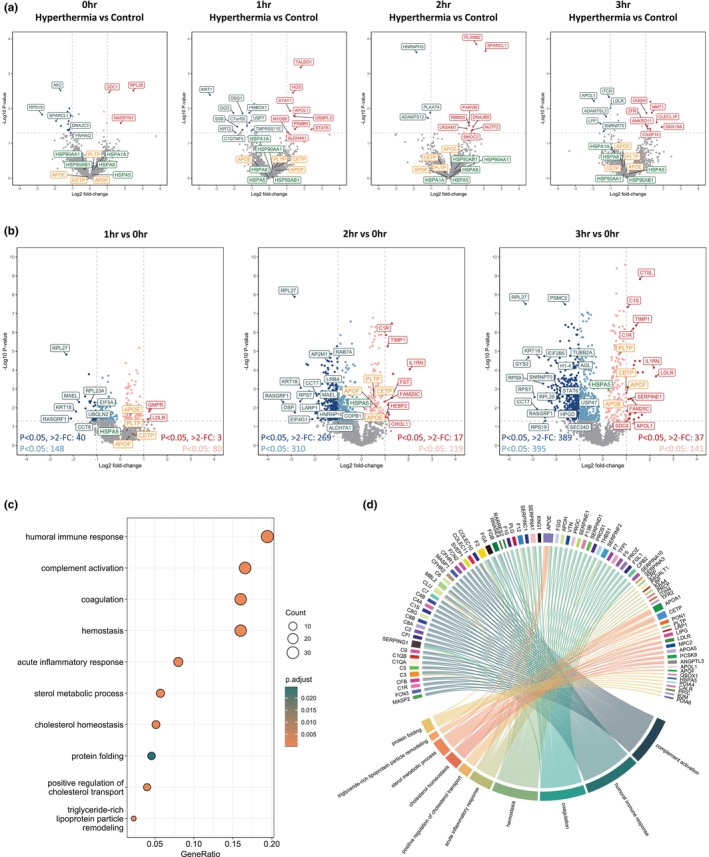
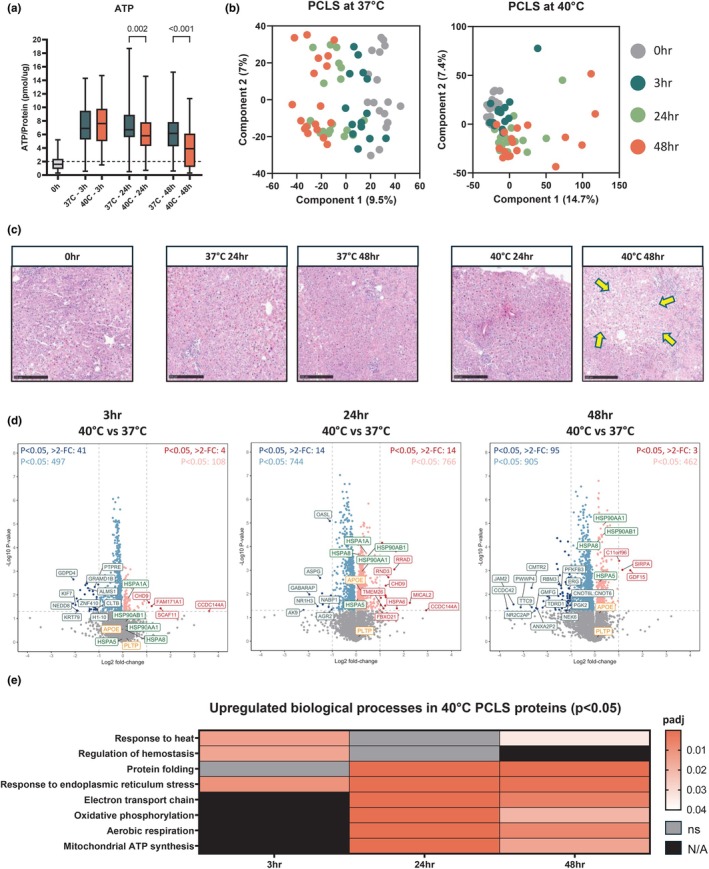
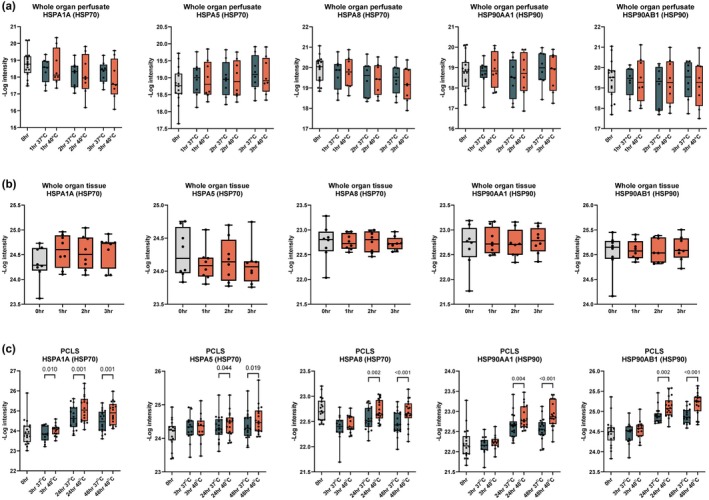
Liver transplantation is the only curative option for end-stage liver disease. Donor shortages necessitate the use of higher risk donor livers, including fatty livers, which are more susceptible to ischemia-reperfusion injury. Machine perfusion has improved graft utilization and is typically performed at hypothermic (8-12°C) or normothermic (35-37°C) temperatures. Here we studied the impact of mild hyperthermia (40°C) as a therapeutic intervention for fatty livers using in-depth proteomic and lipoprotein profiling of whole organ perfusion and precision-cut liver slices. We observed proteomic changes with metabolic alterations over time, evidenced by a significant increase in lipid export in whole organ perfusions. Furthermore, PCLS showed significant upregulation of metabolic processes and heat shock protein response after 24 h of hyperthermia. Machine perfusion under hyperthermic conditions may be a potential strategy to improve the utilization of fatty liver grafts, ultimately expanding the donor pool and improving transplant outcomes.

Keywords: hyperthermia; lipids; liver; machine perfusion; proteomics.


Conflict of interest statement

The authors declare no competing interests.

Figures

FIGURE 1
FIGURE 1
Overview schematic of mild hyperthermia in whole organ perfusion and precision‐cut liver slices (PCLS) models. (a) Whole organ perfusion (n = 16) was performed at 40°C (n = 8) for 3 h on clinical human donor livers following rejection for transplantation after viability assessment using DHOPE‐COR‐NMP. Control perfusions (n = 8) were performed at 37°C on livers accepted for transplantation following viability assessment. PCLS (n = 18) were cut from non‐utilized human donor organs available for research (with no prior machine perfusion) and incubated at 37°C or 40°C for up to 48 h. Proteins from tissue (whole organ and PCLS) and perfusate (whole organ) were then processed for LC–MS/MS analysis using data independent acquisition. Created with Biorender.com. (b) Temperature change protocol. (c) Flow for hepatic artery (HA). (d) Fow for portal vein (PV). (e) Hepatic resistance in HA and PV. (f) Lactate levels in arterial and venous samples. (g) Calculated oxygen consumption (VO2). Perfusion parameters of hepatic artery (HA) and portal vein (PV) for whole organ machine perfusion.
FIGURE 2
FIGURE 2
Proteomics analysis in perfusate from whole organ hyperthermic perfusion (n = 8) and normothermic perfusion (n = 8). (a) Volcano plots showing significance and fold change of protein intensity in perfusate of hyperthermic versus normothermic perfusion at 0, 1, 2 and 3 h. Statistics were performed using a two‐tailed Students t‐test with a permutation‐based FDR of 0.05 to test multiple comparisons. Significant proteins (p < 0.05, >2‐fold change) are highlighted red for upregulated (enriched in hyperthermia) and blue for downregulated (enriched in normothermia). Proteins that were significant but did not reach >2‐fold change are highlighted in light red/blue. Proteins involved in lipid metabolism and heat shock protein responses are highlighted in orange and green, respectively. (b) Volcano plots showing significance and fold change of protein intensity in perfusate over time at 1, 2 and 3 versus 0 h. Statistics were performed using a two‐tailed Students t‐test with a permutation‐based FDR of 0.05 to test multiple comparisons. Significant proteins (p < 0.05, >2‐fold change) are highlighted red for upregulated (enriched at 1, 2 or 3 h) and blue for downregulated (enriched at 0 h). Proteins that were significant but did not reach >2‐fold change are highlighted in light red/blue. Proteins involved in lipid metabolism and heat shock protein responses are highlighted in orange and green, respectively. (c) Dot plot depicting functional enrichment of gene ontology biological processes relating to significant (p < 0.05) proteins after 3h of perfusion. (d) Circos plot showing protein associations with significant gene ontology biological processes at 3 h of perfusion.
FIGURE 3
FIGURE 3
Lipoprotein profiling in whole organ perfusate (n = 8). (a) Triglycerides, (b) total cholesterol, and (c) APOB measured in whole organ machine perfusion perfusate before (0 h, 37°C) and at the end (3 h, 40°C) of hyperthermic perfusion. Box plots are presented as median ± min–max. (d) Lipid profiling of fast protein liquid chromatography (FPLC)‐separated lipoprotein fractions in perfusate. Significance was determined by defining the peaks (VLDL; 26.3–34.8 min) to assess area under the curve (AUC) for each whole organ experiment. AUCs were then analyzed using a paired t‐test. Lines and boundaries denote mean value with standard deviation.
FIGURE 4
FIGURE 4
Proteomics in tissue from whole organ hyperthermic perfusion (n = 8). (a) Volcano plots showing significance and fold change of protein intensity in perfusate at 1, 2 and 3 versus 0 h. Statistics were performed using a two‐tailed Students t‐test with a permutation‐based FDR of 0.05 to test multiple comparisons. Significant proteins (p < 0.05, >2‐fold change) are highlighted red for upregulated (enriched at 1, 2 or 3 h) and blue for downregulated (enriched at 0 h). Proteins that were significant but did not reach >2‐fold change are highlighted in light red/blue. Proteins involved in lipid metabolism and heat shock protein responses are highlighted in orange and green, respectively. (b) H&E histological staining of whole organ tissue after 0 h (37°C), 1, 2 and 3 h (40°C). Scale bars 250 μm.
FIGURE 5
FIGURE 5
Proteomics analysis in tissue from precision‐cut liver slices (PCLS, n = 18). (a) Viability of PCLS were determined by ATP/protein (pmol/μg) content. Data are shown as median ± min–max; 3–6 slices were used in each experiment (n = 18). (b) Principal component analysis showing timepoint variation in PCLS and 37°C and 40°C. (c) H&E histological staining of PCLS after 0, 3, 24 and 48 h with incubation at 37°C and 40°C. Scale bars 250 μm. Arrows highlight patches of necrosis. (d) Volcano plots showing significance and fold change of protein intensity in perfusate at 3, 24 and 48 versus 0 h. Statistics were performed using a two‐tailed Students t‐test with a permutation‐based FDR of 0.05 to test multiple comparisons. Significant proteins (p < 0.05, >2‐fold change) are highlighted red for upregulated (enriched at 3, 24 or 48 h) and blue for downregulated (enriched at 0 h). Proteins that were significant but did not reach >2‐fold change are highlighted in light red/blue. Proteins involved in lipid metabolism and heat shock protein responses are highlighted in orange and green, respectively. (e) Heatmap of upregulated gene ontology biological processes at 3, 24 and 48 h in PCLS at 40°C. ns, not significant; N/A, pathway not identified.
FIGURE 6
FIGURE 6
Heat shock protein (HSP) intensity in whole organ perfusion and PCLS. Protein intensity from LC–MS/MS analysis of HSP1A1, HSPA5, HSPA8, HSP90AA1, and HSP90B1 in (a) whole organ perfusate at 0, 1, 2, and 3 h at 37°C and 40°C, (b) whole organ tissue at 0, 1, 2, and 3 h, and (c) PCLS tissue at 0, 3, 24, and 48 h incubated at 37°C and 40°C. p‐values were calculated using one‐way ANOVA with Holm‐Šídák's multiple comparisons test. Data are shown as median ± min–max.

References

    1. Abbas, S. H. , Ceresa, C. D. L. , Hodson, L. , Nasralla, D. , Watson, C. J. E. , Mergental, H. , Coussios, C. , Kaloyirou, F. , Brusby, K. , Mora, A. , Thomas, H. , Kounali, D. , Keen, K. , Pollok, J. M. , Gaurav, R. , Iype, S. , Jassem, W. , Perera, M. T. P. R. , Hakeem, A. R. , … Friend, P. J. (2024). Defatting of donor transplant livers during normothermic perfusion—A randomised clinical trial: Study protocol for the DeFat study. Trials, 25(1), 386. - PMC - PubMed
    1. Abu‐Amara, M. , Yang, S. Y. , Tapuria, N. , Fuller, B. , Davidson, B. , & Seifalian, A. (2010). Liver ischemia/reperfusion injury: Processes in inflammatory networks—A review. Liver Transplantation, 16(9), 1016–1032. 10.1002/lt.22117 - DOI - PubMed
    1. Archer, A. E. , Rogers, R. S. , von Schulze, A. T. , Wheatley, J. L. , Morris, E. M. , McCoin, C. S. , Thyfault, J. P. , & Geiger, P. C. (2018). Heat shock protein 72 regulates hepatic lipid accumulation. American Journal of Physiology. Regulatory, Integrative and Comparative Physiology, 315(4), R696–R707. - PMC - PubMed
    1. Asrani, S. K. , Devarbhavi, H. , Eaton, J. , & Kamath, P. S. (2019). Burden of liver diseases in the world. Journal of Hepatology, 70(1), 151–171. - PubMed
    1. Aufricht, C. (2005). Heat‐shock protein 70: Molecular supertool? Pediatric Nephrology, 20(6), 707–713. - PubMed

Substances

LinkOut - more resources