. 2025 May 9;16(1):4326.
doi: 10.1038/s41467-025-58533-8.

Maternal gut microbiota influences immune activation at the maternal-fetal interface affecting pregnancy outcome

Affiliations

Maternal gut microbiota influences immune activation at the maternal-fetal interface affecting pregnancy outcome

Silvia Giugliano et al. Nat Commun. .

Abstract

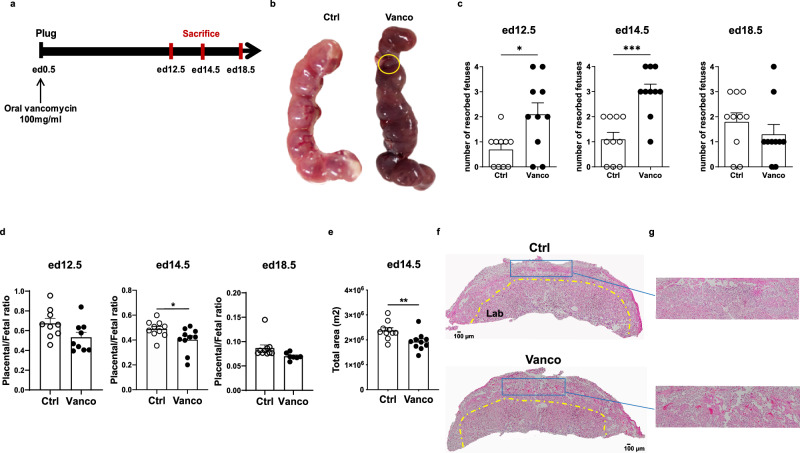
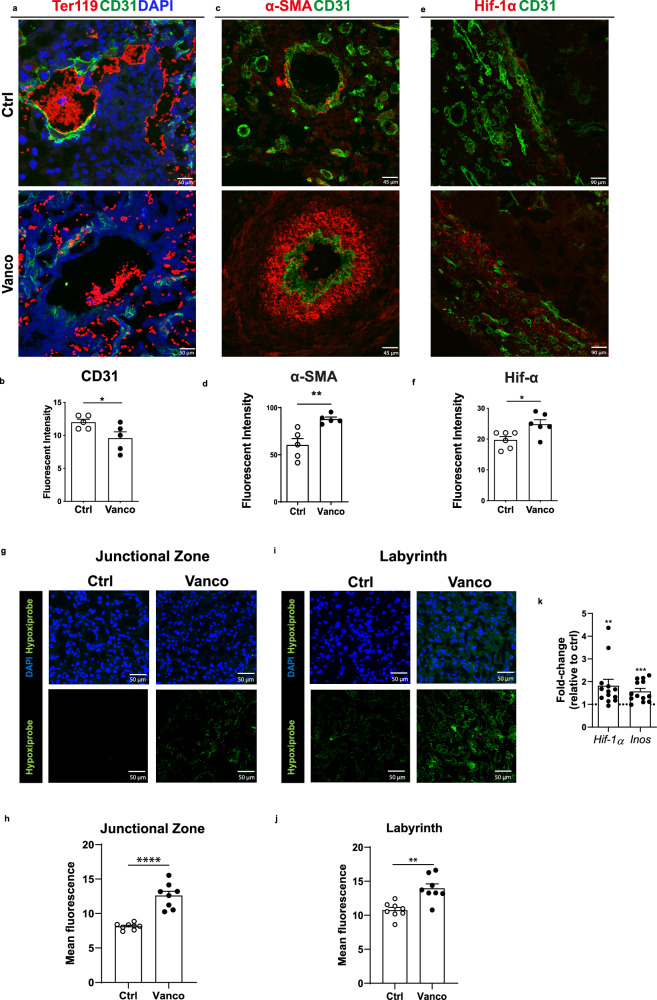
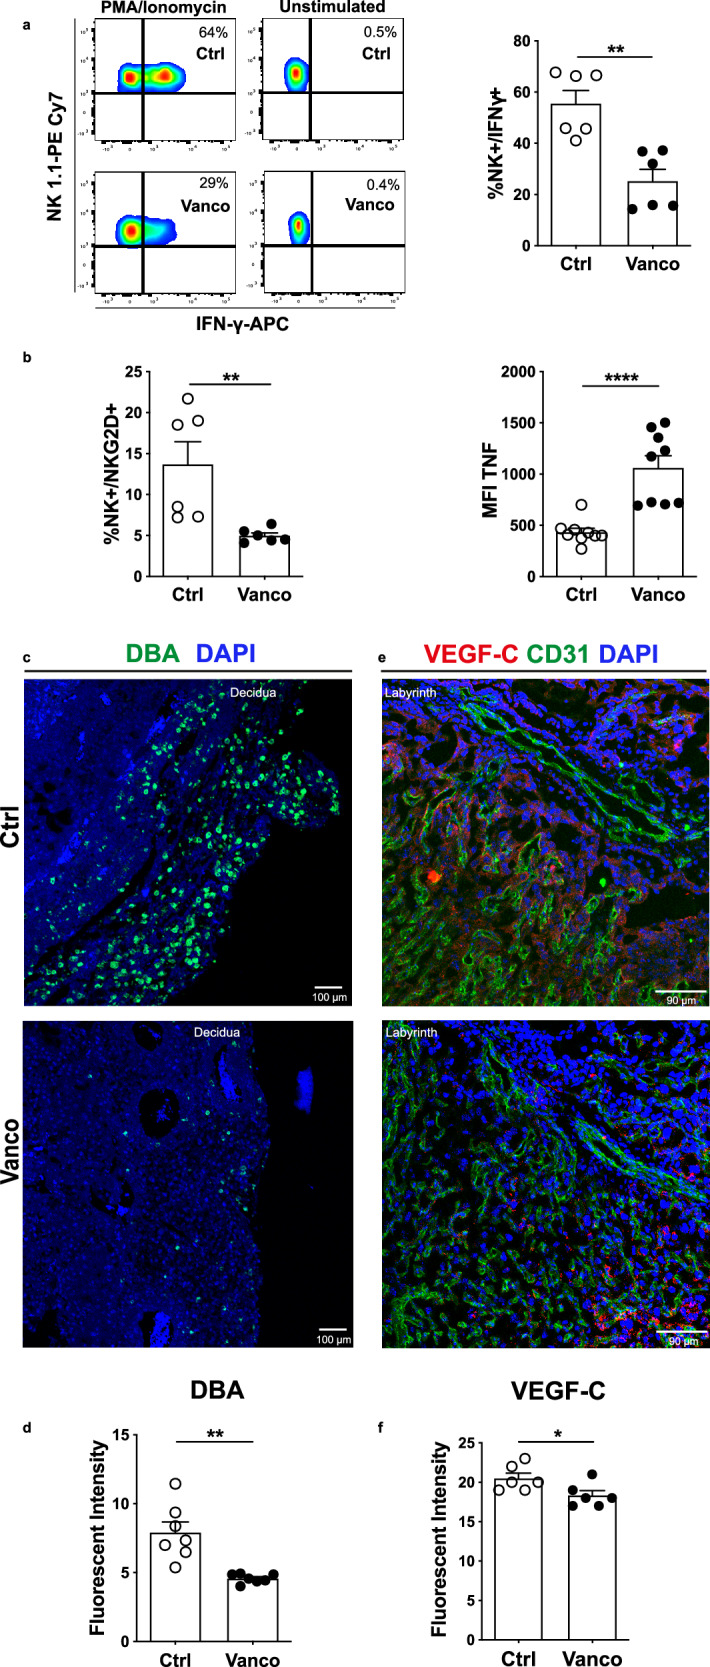
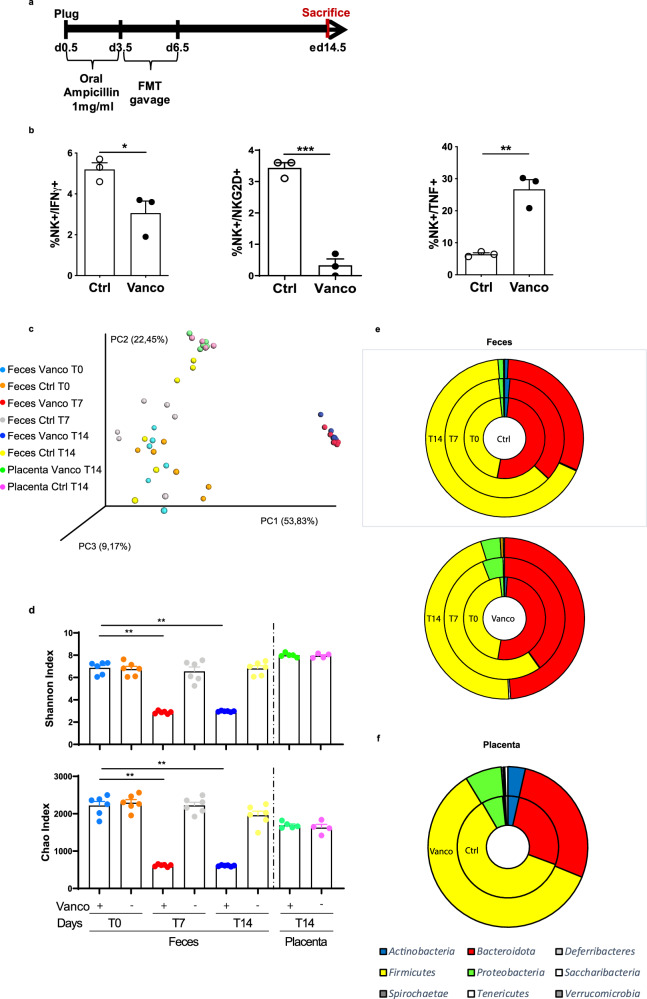
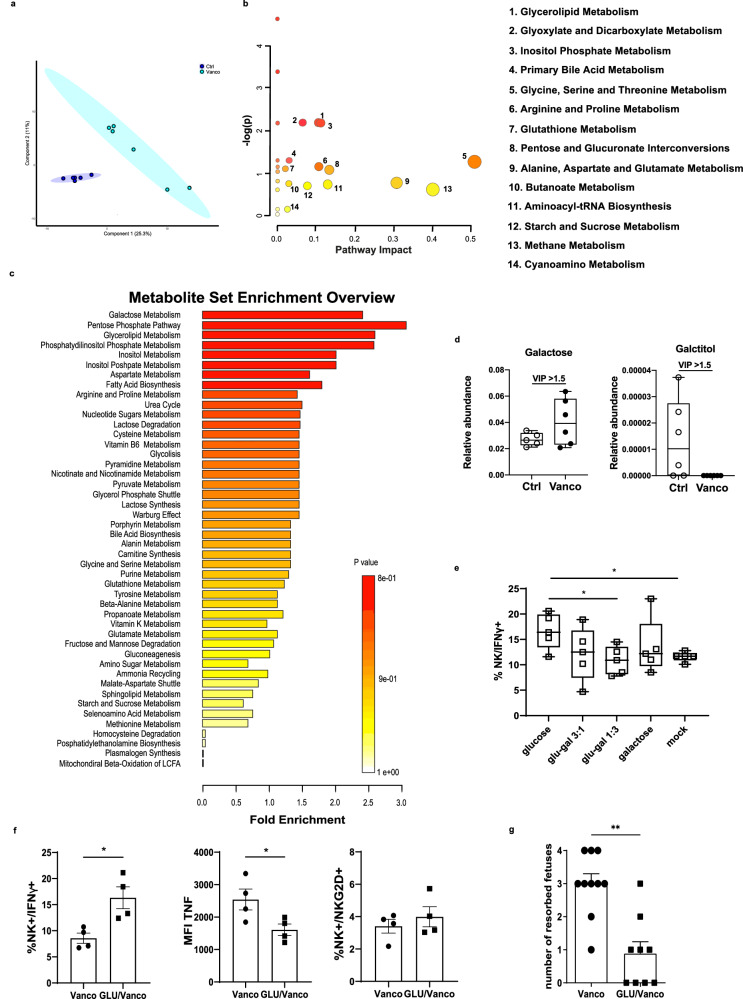
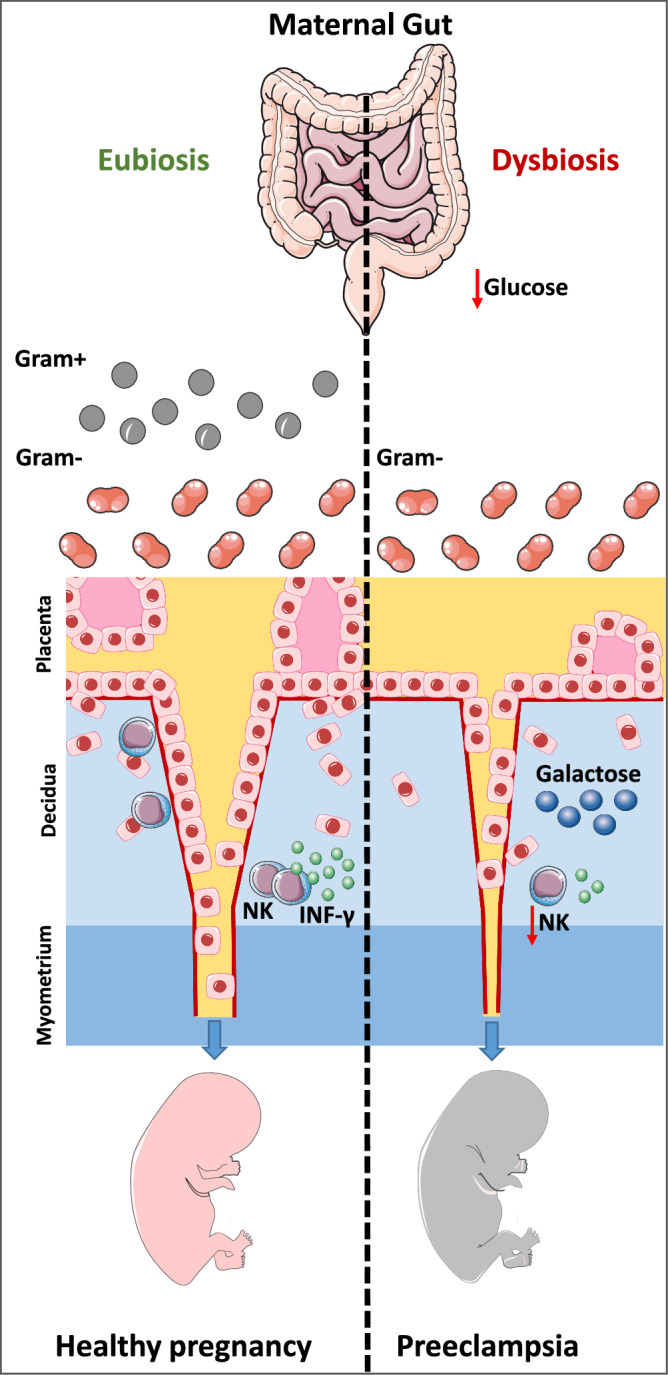
Preeclampsia is a leading cause of morbidity and mortality in pregnant women, affecting 5-8% of gestations worldwide. Its development is influenced by maternal immune abnormalities, metabolic disorders, and gut dysbiosis. In this study, we show that gut dysbiosis in pregnant C57BL/6J dams leads to increased fetal resorption, impaired placental development and altered vascularization. These adverse outcomes are associated with key pathological features of preeclampsia, including hypoxia, endoplasmic reticulum (ER) stress and reduction in uterine natural killer (NK) cell numbers. Furthermore, gut dysbiosis significantly perturbs placental carbohydrate metabolism, which impairs NK cell IFN-γ secretion. Notably, glucose supplementation restores placental NK cell function and reduces fetal resorption, suggesting that the observed impairment is reversible and dependent on a lower glycolytic rate. These findings highlight maternal gut microbiota as a key player in carbohydrate metabolism, with a pivotal role in modulating placental immunity and pregnancy outcome. The results provide valuable insights into potential metabolic biomarkers and suggest that targeting the gut microbiota may offer a strategy for preventing preeclampsia.


Conflict of interest statement

Competing interests: The authors declare no competing interests.

Figures

Fig. 1
Fig. 1. Antibiotic-induced microbiota alterations impact pregnancy outcome.
Schematic representation of the experimental plan (a). Vancomycin treatment (filled symbols) is associated with increased pregnancy loss and fetal resorption at embryonic day (ed) 12.5 (p = 0.0259) and ed14.5 (p = 0.0003) (b, c), significant reduction of placental/fetal ratio at ed14.5 (p = 0.0115, placental weight on fetal weight, d), reduction of the labyrinth area (p = 0.0052, e, f) and increased blood engorgement (g) compared to control pregnancies (open symbols) at ed14.5. Lines represent mean plus SEM, two-sided Mann Whitney test *p < 0.05, **p < 0.01, ***p < 0.001 (ce). Magnification: 10X (f, g). ed: embryonic day; Lab: labyrinth. c includes 10 independent experiments. d represents 9 independent experiments for control and vamcomycin-treated dams at ed12.5, 10 independent experiments for control and vancomycin-treated dams at ed14.5, and 10 independent experiments for control dams and 7 independent experiments for vancomycin-treated dams at ed18.5. In (e), 10 different placentas isolated from 5 experiments were measured. See also Supplementary Fig. 1. Source data are provided as a Source Data file.
Fig. 2
Fig. 2. Effects of antibiotic-induced microbiota alterations on placental vascularization and angiogenesis.
Vancomycin treatment (filled symbols) is associated with a significant reduction of CD31 (green) signaling compared to controls (open symbols) at ed14.5 (a, b, n = 5 samples, p = 0.0481). On the contrary, α-SMA (red, c, d, n = 5 samples, p = 0.0054) and Hif-1α (red, e, f, n = 6 samples, p = 0.0194) expression was increased in the treatment group (filled symbols) compared to controls (open symbols) at ed14.5. Lines represent mean plus SEM, two-sided Unpaired t test (bf), *p < 0.05. Magnification: 40X (A-C), 20X (e), TER119 (red), DAPI (blue). Multiple areas of the samples were measured, and placentas were harvested from 3 different experiments. Vancomycin treatment is associated with a significant increase of Hypoxiprobe signal (green and filled symbols) compared to controls (open symbols) at ed14.5 in both the junctional zone (g, h, n = 8 samples, p < 0.0001) and labyrinth area (i, j, n = 8 samples, p = 0.0010). Magnification: 40X. Multiple areas of the samples were measured, DAPI (blue); placentas were harvested from 4 different experiments. Lines represent mean plus SEM, two-sided Unpaired t test (hj), **p < 0.01, ****p < 0.0001. Vancomycin-treatment induces significant up-regulation of Hif-1α (p = 0.0107) and Nos2 (p = 0.0008) genes in placental tissue at ed14.5 compared to controls (n = 13 samples, k Gene up-regulation was assessed by real-time RT-PCR. Bars represent mean plus SEM, two-sided Wilcoxon signed-rank test, ***p < 0.001, ****p < 0.0001. Placentas were harvested from 3 different experiments. See also Supplementary Fig. 2. Source data are provided as a Source Data file.
Fig. 3
Fig. 3. Impact of antibiotic-induced microbiota alterations on placental immunity.
Placental NK cells of vancomycin-treated dams (filled symbols) show significant less IFN-ɣ production (representative flow cytometry dot plot and statistical summary graph, a, n = 6 experiments, p = 0.0022), lower NKG2D expression (n = 6 experiments, p = 0.0022), and higher TNF (n = 9 experiments, p < 0.0001) secretion compared to control group (open symbols) at ed14.5 (b). Vancomycin treatment (filled symbols) is associated with significant decrease of DBA+ uNK cell number in the decidua (green, c, d, n = 7 samples, p = 0.0010), and VEGF-C expression in the labyrinth area (red, e, f, n = 6 samples, p = 0.0385), compared to control pregnancies (open symbols) at ed14.5. Lines represent mean plus SEM, two-sided Mann Whitney t test (a, b), two-sided Unpaired t test (df), *p < 0.05, **p < 0.01, ****p < 0.0001. Magnification: 20X, DAPI (blue), CD31 (green, ce). In a and b each measurement was taken from the placentas isolated from one single experiment, with all placentas from one dam combined into a single data point. In d and f different areas of the samples were analyzed; placentas were harvested from 3 different experiments. See also Supplementary Fig. 3, Supplementary Figs. 4 and  5. Source data are provided as a Source Data file.
Fig. 4
Fig. 4. Impact of vancomycin-treatment on gut and placental microbiota during pregnancy.
Schematic representation of FMT treatment performed in pregnant dams (a). Stools from vancomycin-treated mice (filled symbols) reduce IFN-ɣ (p = 0.0329), NKG2D (p = 0.0004) expression, and induce higher TNF (p = 0.0025) secretion in maternal NK cells compared to controls (open symbols) at ed14.5 (n = 3 experiments, b). Microbiome clustering based on unweighted Principal Coordinate Analysis (PCA) UniFrac metrics of fecal and placental microbiota derived from vancomycin-treated and untreated dams at T0 (feces ed0.5: light blue vancomycin, orange control), T7 (feces ed7.5: red vancomycin, gray control) and T14 (feces ed14.5: blue vancomycin, yellow control; placentas: green vancomycin, pink control, c). Graph showing microbial richness and evenness on the Shannon index (upper panel, T0 vs. T7 p = 0.0022, T0 vs. T14 p = 0.0022) and microbial richness based on the Chao1 index (lower panel, d, T0 vs. T7 p = 0.0022, T0 vs. T14 p = 0.0022). The 16S analysis was performed on fecal samples from 6 control and 6 vancomycin-treated dams, as well as placental samples from 5 control and 4 vancomycin-treated dams. Pie charts showing the relative abundance of the most abundant Phyla present in the stool (n = 6, e) and placenta (n = 6, f) of treated and control groups (Actinobacteria = blue, Bacteroidota = red, Deferribacteres = light gray, Firmicutes = yellow, Proteobacteria = bright green, Saccharibacteria = dim green, Spirochaetae: dark grey, Tenericutes = brown, Verrucomicrobia = mid gray). Lines represent mean plus SEM, two-sided Unpaired t test (b), two-sided Mann Whitney t test (d), *p < 0.05, p**<0.01, ***p < 0.001. Each measurement was taken from a distinct experiment. See also Supplementary Figs. 6–10. Source data are provided as a Source Data file.
Fig. 5
Fig. 5. Effect of antibiotic-induced microbiota alterations on intestinal metabolome.
PCA of fecal metabolome in vancomycin-treated (green) and control (blue) dams at ed14.5 (n = 6, a). Box and Whisker plot representation of the metabolites showed a VIP-score >1.5 (n = 6 experiments, b). The plot shows all individual data points. Horizontal lines within the plot indicate the median values. Microbe-metabolite correlation heatmap suggesting associations between bacterial phyla and VIP-score selected metabolites at ed14.5. Spearman correlation coefficients were calculated for pairwise combinations of microbial abundances at the phyla level from 16S rRNA gene sequencing data and metabolite intensities (c). Pathway impact (d) and Metabolite Set Enrichment Overview (e) of vancomycin-treated dams normalized to control group at ed14.5. Global test algorithm was employed for both pathway impact and pathway enrichment analysis, Metaboanalyst3.0 (http://www.metaboanalyst.ca). Each measurement was taken from a distinct experiment. See also Supplementary Fig. 11. Source data are provided as a Source Data file.
Fig. 6
Fig. 6. Effect of antibiotic-induced microbiota alterations on placental metabolome.
PCA of placental metabolome in vancomycin-treated (green) and control (blue) dams at ed14.5 (n = 6, a). Pathway (b) and Metabolite Set Enrichment Analysis (c) of placental metabolites with a VIP score >1.5 at ed14.5. Global test algorithm was employed for both pathway impact and pathway enrichment analysis. Box and Whisker plot representation of galactose, and galactitol placental relative abundance at ed14.5 (n = 6 experiments, d). The plot shows all individual data points. Horizontal lines within the plot indicate the median values. Placental NK cells of control dams (ed14.5) significantly reduced IFN-γ production after 5 hours stimulation with PMA/ionomycin in media supplemented with a glucose:galactose ratio of 1:3 (n = 5 experiments, e, p = 0.0209). Placental NK cells of vancomycin-treated dams orally treated with 30 g/kg of glucose before sacrifice (ed14.5) show increased IFN-γ (p = 0.0151) production and less TNF (p = 0.0440) production after 5 hours stimulation with PMA/ionomycin in media (filled squares) compared to vancomycin-treated dams (filled circles) (f). Two-sided Unpaired t test (e), the plot shows all individual data points. Horizontal lines within the plot indicate the median values. Lines represent mean plus SEM, two-sided Unpaired t test (n = 4 experiments, f), *p < 0.05, ****p < 0.0001. Glucose administration to vancomycin-treated dams (n = 9, 30 g/kg per 3 days before sacrifice at ed14.5, squared filled symbols) decreases pregnancy loss compared to vancomycin treatment alone (n = 10 experiments, round filled symbols, g, p = 0.0011). Lines represent mean plus SEM, two-sided Mann and Whitney test, **p < 0.01. Each measurement was taken from a single experiment. See also Supplementary Figs. 12–14. Source data are provided as a Source Data file.
Fig. 7
Fig. 7. Impact of maternal gut dysbiosis on pregnancy outcome.
Vancomycin-induced dysbiosis reduces intestinal glucose availability and alters placental carbohydrate metabolism causing a reduction of NK cells metabolic fuel availability. Such a shift directly impacts NK cell vascularization and angiogenic capacity, causing impairment of placental development and fetal resorption. This figure was generated using Servier Medical Art, provided by Servier, which is licensed under CC BY 4.0 (https://creativecommons.org/licenses/by/4.0/).

Similar articles

Cited by

References

    1. Abalos, E., Cuesta, C., Grosso, A. L., Chou, D. & Say, L. Global and regional estimates of preeclampsia and eclampsia: a systematic review. Eur. J. Obstet. Gynecol. Reprod. Biol.170, 1–7 (2013). - PubMed
    1. Brown, M. A. et al. Hypertensive disorders of pregnancy: ISSHP classification, diagnosis, and management recommendations for International Practice. Hypertension72, 24–43 (2018). - PubMed
    1. Roberts, J. M. et al. Hypertension in pregnancy. Report of the American College of Obstetricians and Gynecologists’ Task Force on Hypertension in Pregnancy. Obstet. Gynecol.122, 1122–1131 (2013). - PubMed
    1. Redman, C. W. G., Staff, A. C. & Roberts, J. M. Syncytiotrophoblast stress in preeclampsia: the convergence point for multiple pathways. Am. J. Obstet. Gynecol.226, S907–s927 (2022). - PubMed
    1. Burton, G. J. Oxygen, the Janus gas; its effects on human placental development and function. J. Anat.215, 27–35 (2009). - PMC - PubMed

MeSH terms

LinkOut - more resources