. 2025 May 9;16(1):371.
doi: 10.1038/s41419-025-07554-8.

CILP1 interacting with YBX1 promotes hypertrophic scar formation by suppressing PPARs transcription

Affiliations

CILP1 interacting with YBX1 promotes hypertrophic scar formation by suppressing PPARs transcription

Jianzhang Wang et al. Cell Death Dis. .

Abstract

Hypertrophic scar (HS) represents the most prevalent form of skin fibrosis, significantly impacting the quality of life. Despite this, the molecular mechanisms driving HS formation remain largely undefined, impeding the development of effective treatments. The study showed that Cartilage Intermediate Layer Protein 1 (CILP1) was predominantly expressed in myofibroblasts and was up-regulated in various forms of skin fibrosis, including human hypertrophic and keloid scars, and in animal models of HS. Notably, we detected elevated serum levels of CILP1 in fifty-two patients with HS compared to twenty healthy individuals, suggesting its potential as a novel biomarker. The findings indicated that CILP1 was involved in a negative feedback loop with TGF-β and inhibited the transcription of Peroxisome Proliferator-Activated Receptors (PPARs) via interaction with Y-box-binding protein 1 (YBX1). This interaction promoted cell proliferation, migration, and collagen production in hypertrophic scar fibroblasts (HSFs). In vivo studies further confirmed that CILP1 knockdown markedly reduced HS formation, whereas administration of recombinant human CILP1 protein exacerbated it. These discoveries illuminated the CILP1-YBX1-PPARs signaling pathway as a key regulator of HS formation, offering a foundation for novel therapeutic approaches.


Conflict of interest statement

Competing interests: The authors declare no competing interests. Ethical approval and consent to participate: The study was conducted in accordance with the principles of the Helsinki Declaration. All patients were informed of the study purpose and processes and provided the informed consent for participation into the present work. The Ethics Committee of Xijing Hospital affiliated to the Fourth Military Medical University approved the present work (approval number: No.KY20203134-1). Our animal experiments followed the Guide for the Care and Use of Laboratory Animals. Experimental protocols were approved by the Committee on the Ethics of Animal Experiments of Fourth Military Medical University; approval number: No.20230033. Consent for publication: All authors have read and approved the final manuscript.

Figures

Fig. 1
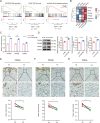
Fig. 1. The expression of CILP1 was increased in human skin fibrotic tissues, various animal models of skin fibrosis, and serums of HS patients.
A RNA sequencing results of CILP1 in six pairs of human NS and HS tissues (n = 6). B qRT-PCR demonstrated the increased expression of CILP1 in five pairs of NS and HS tissues (n = 5). C Western blot demonstrated the elevated expression of CILP1 in three pairs of NS and HS tissues (n = 3). D ELISA revealed the levels of CILP1 in serums of patients with HS within one year (n = 18), patients with HS over one year (n = 34), and healthy controls (n = 20). E The results of immunohistochemistry staining for CILP1 in five pairs of human NS and HS tissues (n = 5). Scale bar = 100 µm. F The immunohistochemistry staining for CILP1 within five pairs of human NS and KS (keloid scar) samples (n = 5). Scale bar = 100 µm. G Representative images of CILP1 immunohistochemistry staining in the scar tissues of the load-induced hypertrophic scar mouse model (n = 5 per group). Scale bar = 100 µm. H Representative images of CILP1 immunohistochemistry staining in the scar tissues of the hypertrophic scar mouse model (n = 5 per group). Scale bar = 100 µm. I Immunohistochemistry staining of CILP1 in scar tissues obtained from the rabbit ear hypertrophic scar model (n = 5 per group). Scale bar = 100 µm. Sample size is indicated as individual plots in column graphs. Data are shown as mean ± SD. *P < 0.05, **P < 0.01, ***P < 0.001.
Fig. 2
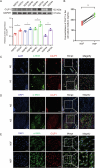
Fig. 2. Upregulated levels of CILP1 in HSFs and HSFs cell culture medium.
A Western blot results of CILP1 in four pairs of NSFs and HSFs (n = 4). B The results of ELISA demonstrated the increased concentrations of CILP1 in the cell culture supernatants of four pairs of HSFs and NSFs (n = 4). C Immunofluorescence results showed the co-staining of CILP1 and α-SMA in NS and HS tissues. Scale bar = 100 μm. D Immunofluorescence results showed the co-staining of CILP1 and α-SMA in NS and KS tissues. Scale bar = 100 μm. E Immunofluorescence results exhibited that CILP1 was co-stained with α-SMA in NSFs and HSFs. Scale bar = 100 µm. Sample size is indicated as individual plots in column graphs. Data are displayed as mean ± SD. *P < 0.05, **P < 0.01.
Fig. 3
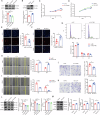
Fig. 3. CILP1 contributed to HSFs proliferation and migration.
A Knockdown efficiency of si-CILP1 in HSFs (n = 3). B The overexpression efficiency of OE-CILP1 in HSFs (n = 3). C CCK-8 assay revealed the inhibition of knocking down CILP1 with si-CILP1#2 on HSFs proliferation (n = 3). D CCK-8 assay demonstrated the enhancement of CILP1 overexpression on HSFs proliferation. E EdU staining of HSFs after being treated with si-NC or si-CILP1#2 (Quantitative analysis of EdU-positive cell proportion. n = 5 Scale bar = 100 µm). F EdU staining of HSFs after being treated with OE-NC or OE-CILP1. (Quantitative analysis of EdU-positive cell proportion. n = 5. Scale bar = 100 µm). G Flow cytometry results and quantification of cell cycles in HSFs treated with si-NC or si-CILP1#2 (n = 3). H Images and wound healing assay results of si-NC or si-CILP1 groups (Dotted lines indicate the scratch areas. n = 3. Scale bar = 200 µm.). I Images and wound healing assay results of OE-NC and OE-CILP1 groups (Dotted lines indicate the scratch areas. n = 3. Scale bar = 200 µm). J Images and Transwell assay results of si-NC and si-CILP1 groups (n = 3. Scale bar = 100 µm). K Images and Transwell assay results of OE-NC and OE-CILP1 groups (n = 3. Scale bar = 100 µm). L MMP2, MMP9, and VIM levels in HSFs after si-NC or si-CILP1 treatment through Western blot assay (n = 3). M Western blot analysis on MMP2, MMP9, and VIM levels in HSFs after OE-NC and OE-CILP1 treatment (n = 3). Sample size is indicated as individual plots in column graphs. Data are presented as mean ± SD. *P < 0.05, **P < 0.01, ***P < 0.001.
Fig. 4
Fig. 4. CILP1 promoted cell activation, proliferation, migration, and extracellular matrix synthesis of HSFs.
A Images and collagen gel contraction quantification results of si-NC and si-CILP1 groups (n = 3). B Images and collagen gel contraction quantification assays of OE-NC and OE-CILP1 groups (n = 3). C Immunofluorescence showed the α-SMA staining results in HSFs treated with si-NC or si-CILP1#2. Scale bar = 100 µm. D Immunofluorescence showed the α-SMA staining results in HSFs treated with OE-NC or OE-CILP1. Scale bar = 100 µm. E Western blot assay showed α-SMA, COL I, and COL III levels in HSFs treated with si-NC or si-CILP1#2 (n = 3). F Results of Western blot exhibited α-SMA, COL I, and COL III levels within HSFs treated with OE-NC and OE-CILP1 (n = 3). G CCK-8 assay showed the proliferative capacity of HSFs treated with recombinant human CILP1 protein (0, 50, 100, 150 ng/mL) (n = 3). H, I Images and quantitative results of the Transwell assay in HSFs treated with recombinant human CILP1 protein (0, 50, 100, 150 ng/mL) (n = 5). J Western blot assay detected MMP2, MMP9, and VIM levels in HSFs treated with recombinant human CILP1 protein (0, 50, 100, 150 ng/mL) (n = 3). K Results of Western blot showed α-SMA, COL I, and COL III levels in HSFs treated with recombinant human CILP1 protein (0, 50, 100, 150 ng/mL) (n = 3). Sample size is indicated as individual plots in column graphs. Results are indicated by mean ± SD. *P < 0.05, **P < 0.01, ***P < 0.001.
Fig. 5
Fig. 5. CILP1 and TGF-β pathway formed a negative feedback loop in HSFs.
A Western blot assay showed CILP1 level in HSFs under stimulation with TGF-β1 (0, 10, 15, 20 ng/mL) for 48 h (n = 3). B Results of immunofluorescence displayed the expression of CILP1 and α-SMA expression in HSFs after TGF-β1 treatment (0, 10 ng/mL). C CCK-8 assay exhibited the proliferative capacity of HSFs after knocking down CILP1 with si-CILP1#2 or/and stimulation with TGF-β1 (0, 10 ng/mL) (n = 3). D Images and Transwell assay results of HSFs following knocking down CILP1 with si-CILP1#2 or/and stimulation with TGF-β1 (0, 10 ng/mL) (n = 5). E CILP1, α-SMA, COL I, and COL III protein expression in HSFs after knocking down CILP1 or/and stimulation with TGF-β1 (0, 10 ng/mL) (n = 3). F Western blot results showed that knocking down CILP1 with si-CILP1#2 activated TGF-β pathway in HSFs (n = 3). G Western blot results displayed that knocking down CILP1 with si-CILP1#2 significantly inhibited ERK1/2 pathway in HSFs (n = 3). H CCK-8 assay showed the proliferative capacity of HSFs after knocking down CILP1 with si-CILP1#2 or/and stimulation with TGF-β1 pathway inhibitor SB431542 (0, 10 μM) (n = 3). I Images and quantitative results of the Transwell assay of HSFs after knocking down CILP1 with si-CILP1#2 or/and stimulation with TGF-β1 pathway inhibitor SB431542 (0, 10 μM) (n = 5). J, K α-SMA, p-Smad2/3, TGF-β1, COL I, and COL III protein expression in HSFs following indicated treatment (n = 3). Sample size is indicated as individual plots in column graphs. Results are indicated by mean ± SD. *P < 0.05, **P < 0.01, ***P < 0.001.
Fig. 6
Fig. 6. CILP1 suppressed PPARs expression in HSFs and HS tissues.
A GSEA analysis of differentially-expressed genes (DEGs) after CILP1 knockdown in HSFs. Pathways including PPARs signaling pathway, DNA replication, and Cell cycle are displayed. B Heatmap of representative genes significantly regulated by CILP1 in HSFs by RNA sequencing analysis. C qRT-PCR results showed that CILP1 knockdown significantly elevated PPARα, PPARδ, and PPARγ mRNA expression in HSFs (n = 3). D Western blot results showed that CILP1 knockdown significantly increased PPARα, PPARδ, and PPARγ protein expression in HSFs (n = 3). EG Immunohistochemistry staining exhibited the decreased protein expression of PPARα, PPARδ, and PPARγ in HS relative to their corresponding normal skin in five pairs of human HS and NS tissues (n = 5). Scale bar = 100 µm. Sample size is indicated as individual plots in column graphs. Results are indicated by mean ± SD. *P < 0.05, **P < 0.01, ***P < 0.001.
Fig. 7
Fig. 7. Inhibiting PPARs pathway enhanced the profibrotic effects of CILP1 on HSFs.
A CCK-8 assay showed the HSFs proliferation after being treated with si-CILP1#2 and/or PPARα inhibitor GW6471 (0, 25 μM), PPARδ inhibitor GSK3787 (0, 5 μM), or PPARγ inhibitor GW9662 (0, 20 μM) (n = 3). B Images and Transwell assay results of HSFs following indicated treatments (n = 5). C PPARα, α-SMA, COL I, and COL III protein expression in HSFs after being treated with si-CILP1#2, PPARα inhibitor GW6471 (0, 25 μM), or PPARs pathway pan-inhibitor Norathyriol (0, 25 μM) detected by Western blot (n = 3). D PPARδ, α-SMA, COL I and COL III protein expression within HSFs after being treated with si-CILP1#2, PPARδ inhibitor GSK3787 (0, 5 μM), or PPARs pathway pan-inhibitor Norathyriol (0, 25 μM) detected by Western blot (n = 3). E PPARγ, α-SMA, COL I and COL III protein expression in HSFs after being treated with si-CILP1#2, PPARγ inhibitor GW9662 (0, 20 μM), or PPARs pathway pan-inhibitor Norathyriol (0, 25 μM) measured through Western blot (n = 3). Sample size is indicated as individual plots in column graphs. Results are indicated by mean ± SD. *P < 0.05, **P < 0.01, ***P < 0.001.
Fig. 8
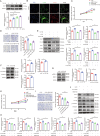
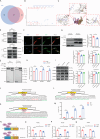
Fig. 8. CILP1 suppressed PPARs pathway in HSFs by interacting with YBX1.
A Venn diagram of CILP1 binding proteins screened by mass spectrometry. B Candidate interacting protein of YBX1 identified by mass spectrometry. C Molecular docking between CILP1 and YBX1. D Co-IP results of CILP1 and YBX1 in HSFs. E GST pull-down assay was performed to observe the direct interaction between CILP1 and YBX1. F Immunofluorescence staining demonstrated that CILP1 knockdown reduced the expression and nuclear location of YBX1 in HSFs. Scale bar = 50 µm. G Nuclear and cytoplasmic protein extraction assay results demonstrated that CILP1 knockdown reduced the YBX1 level in the nuclear fraction of HSFs (n = 3). H qRT-PCR results showed that YBX1 knockdown significantly elevated PPARα, PPARδ, and PPARγ mRNA expression in HSFs (n = 3). I Western blot results demonstrated that YBX1 knockdown significantly increased PPARα, PPARδ, and PPARγ protein expression of HSFs (n = 3). JL JASPAR software predicted the binding sites of YBX1 in the promoters of PPARα, PPARδ, and PPARγ respectively. M ChIP-qPCR confirmed the binding of YBX1 to the promoters of PPARα, PPARδ, and PPARγ (n = 3). NQ The luciferase reporter assay results demonstrated that YBX1 could target these three sites of PPARα, PPARδ, and PPARγ promoters in 293T cells (n = 3). Sample size is indicated as individual plots in column graphs. Results are indicated by mean ± SD. *P < 0.05, **P < 0.01, ***P < 0.001.
Fig. 9
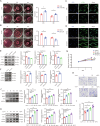
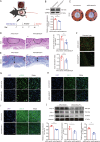
Fig. 9. CILP1 knockdown attenuates hypertrophic scar formation in C57BL/6 mice.
A Schematic diagram of mice hypertrophic scar model construction. B Validation of AAV2-mediated knockdown efficiency of CILP1 in mice using Western blot assay (n = 3). C Representative gross photographs of scars of mice from AAV2-shNC and AAV2-shCILP1 groups. Knocking down CILP1 reduced the areas of scars. D Images of scar tissues stained by H&E staining and quantification of scar tissue areas (n = 6 per group). The dashed line indicated the scar tissues. Scale bar = 200 µm. E Images and SEI quantification of scars from AAV2-shCtrl and AAV2-shCILP1 groups (n = 6 per group). The long “D” and short “d” arrows stand for hypertrophic scar and normal skin tissue thicknesses, separately. “Scar elevation index” is determined by D/d ratio. Scale bar = 200 µm. F Collagen density exhibited by Sirius red staining. Red and yellow areas stand for COL I, while green area indicates COL III. Scale bar = 50 µm. GI Immunofluorescence staining demonstrated that knocking down CILP1 attenuated COL I, COL III, and α-SMA proteins expression. J Western blot assay suggested that knocking down CILP1 decreased COL I, COL III and α-SMA protein expression (n = 3). Sample size is indicated as individual plots in column graphs. Results are indicated by mean ± SD. *P < 0.05, **P < 0.01, ***P < 0.001.
Fig. 10
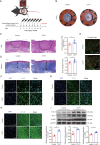
Fig. 10. Recombinant human CILP1 protein promotes hypertrophic scar formation in C57BL/6 mice.
A Schematic diagram of hypertrophic scar model. B Representative gross photographs of scars of mice from control and recombinant human CILP1 protein groups. Recombinant human CILP1 protein increased the areas of scars. C Images of scar tissues stained by H&E staining and quantification of scar tissue areas (n = 6 per group). The dashed line indicated the scar tissues. Scale bar = 200 µm. D Images and SEI quantification of scars in control and recombinant human CILP1 protein groups (n = 6 per group). The long “D” and short “d” arrows stand for hypertrophic scar and normal skin tissue thicknesses, separately. “Scar elevation index” is determined by D/d ratio. Scale bar = 200 µm. E Collagen density exhibited by Sirius red staining. Red and yellow areas stand for COL I, while green area indicates COL III. Scale bar = 50 µm. FH Immunofluorescence staining demonstrated that recombinant human CILP1 protein increased COL I, COL III, and α-SMA proteins expression. I Western blot results showed that recombinant human CILP1 protein increased COL I, COL III, and α-SMA protein expression (n = 3). Sample size is indicated as individual plots in column graphs. Results are indicated by mean ± SD. *P < 0.05, **P < 0.01, ***P < 0.001.
Fig. 11
Fig. 11. Schematic diagram of the proposed mechanism.
CILP1 was upregulated in hypertrophic scar and harbored potential to be a biomarker for hypertrophic scar. CILP1 was involved in a negative feedback loop with TGF-β and inhibited the transcription of PPARs via interaction with YBX1. This interaction promoted cell proliferation, migration, and collagen production in HSFs.

Similar articles

References

    1. Moortgat P, Meirte J, Maertens K, Lafaire C, De Cuyper L, Anthonissen M. Can a Cohesive Silicone Bandage Outperform an Adhesive Silicone Gel Sheet in the Treatment of Scars? A Randomized Comparative Trial. Plast Reconstr Surg. 2019;143:902–11. - PubMed
    1. Frangogiannis N. Transforming growth factor-beta in tissue fibrosis. J Exp Med. 2020;217:e20190103. - PMC - PubMed
    1. Gao Y, Liu Y, Zheng D, Ho C, Wen D, Sun J, et al. HDAC5-mediated Smad7 silencing through MEF2A is critical for fibroblast activation and hypertrophic scar formation. Int J Biol Sci. 2022;18:5724–39. - PMC - PubMed
    1. Sen CK, Gordillo GM, Roy S, Kirsner R, Lambert L, Hunt TK, et al. Human skin wounds: a major and snowballing threat to public health and the economy. Wound Repair Regen. 2009;17:763–71. - PMC - PubMed
    1. Gold MH, Berman B, Clementoni MT, Gauglitz GG, Nahai F, Murcia C. Updated international clinical recommendations on scar management: part 1-evaluating the evidence. Dermatol Surg. 2014;40:817–24. - PubMed

MeSH terms

Substances

Grants and funding

LinkOut - more resources