

Association between triglyceride-glucose index and all cause mortality in critically ill patients with heart failure
- PMID: 40346064
- PMCID: PMC12064809
- DOI: 10.1038/s41598-025-00129-9
Association between triglyceride-glucose index and all cause mortality in critically ill patients with heart failure
Abstract
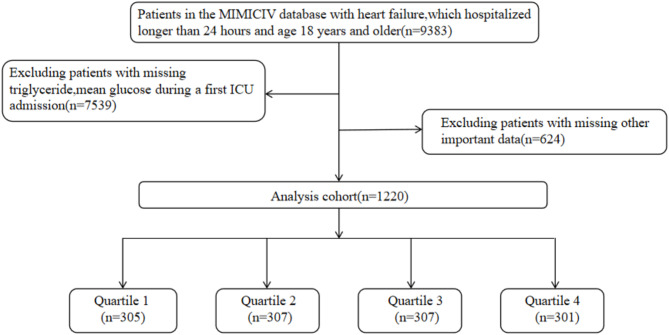
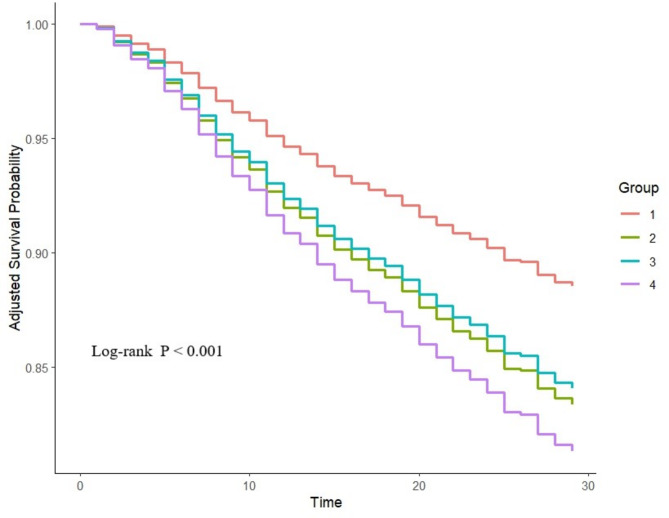
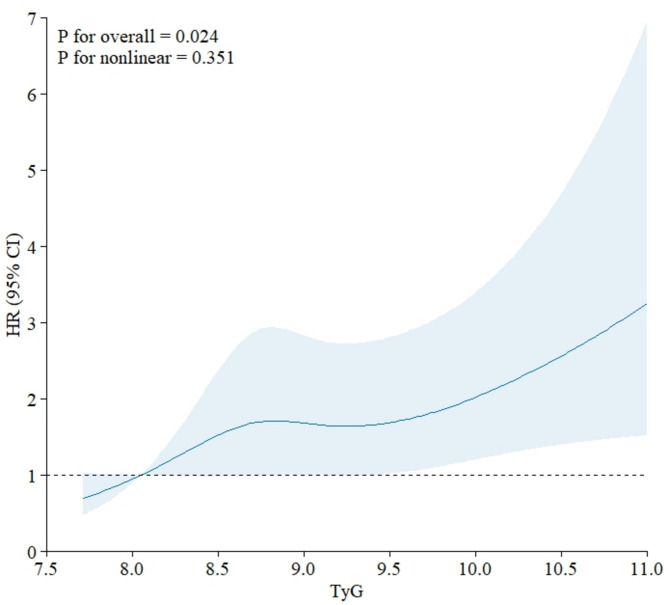
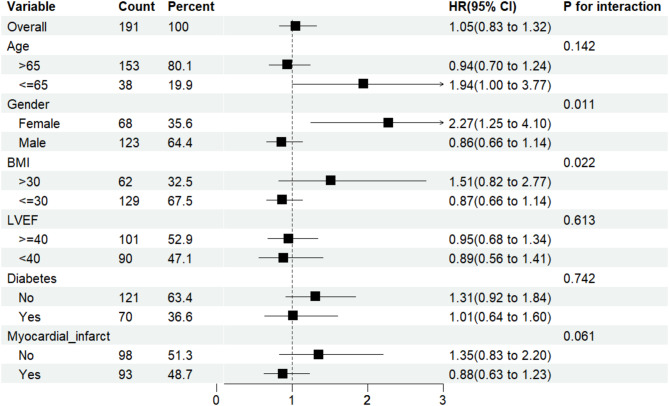
The triglyceride-glucose (TyG) index is regarded as a surrogate marker of systemic insulin resistance (IR). Studies have substantiated the impact of IR on cardiovascular diseases. Nonetheless, the prognostic value of the TyG index in critical patients with heart failure (HF) with intensive care unit (ICU) admission remains unclear. This study aims to assess the association between the TyG index and all-cause mortality in critically ill patients with HF. Patients with HF requiring ICU admission were identified from the Medical Information Mart for Intensive Care IV (MIMIC-IV) database and subsequently stratified into quartiles based on their TyG index. The primary outcome was 30-day all-cause mortality, and the secondary outcome was 1-year all-cause mortality. The relationship between the TyG index and all-cause mortality in HF patients was analyzed using multivariable Cox proportional hazards models and restricted cubic splines. A total of 1220 patients (62.4% men) were enrolled, with a mean age of 70.6 years. The 30-day and one-year all-cause mortality rate were 15.7% and 34.6%, respectively. Multivariable Cox regression revealed that TyG index was significantly associated with an elevated risk of 30-day all-cause mortality (adjusted HR, 1.360; 95% CI, 1.093-1.694; P = 0.006), but not with one-year mortality (adjusted HR 1.046; 95% CI 0.895-1.222, P = 0.574). Restricted cubic splines showed a progressively increasing risk of 30-day mortality was linearly related to an elevated TyG index. Subgroup analyses indicated a more prominent association between TyG index and 30-day mortality in patients with age ≤ 65, female or BMI > 30 kg/m2. In critically ill patients with HF, the TyG index is significantly associated with short-term all-cause mortality. Our results highlight that the TyG index can be useful in identifying HF patients at high risk of all-cause mortality and require close follow-up after discharge.
Keywords: All-cause mortality; Heart failure; Insulin resistance; MIMIC-IV database; Triglyceride-glucose index.
© 2025. The Author(s).
Conflict of interest statement
Declarations. Competing interests: The authors declare no competing interests.
Figures
Similar articles
-
Long-term survival in stroke patients: insights into triglyceride-glucose body mass index from ICU data.Cardiovasc Diabetol. 2024 Apr 25;23(1):137. doi: 10.1186/s12933-024-02231-0. Cardiovasc Diabetol. 2024. PMID: 38664780 Free PMC article.
-
Comparative study on the predictive value of TG/HDL-C, TyG and TyG-BMI indices for 5-year mortality in critically ill patients with chronic heart failure: a retrospective study.Cardiovasc Diabetol. 2024 Jun 20;23(1):213. doi: 10.1186/s12933-024-02308-w. Cardiovasc Diabetol. 2024. PMID: 38902757 Free PMC article.
-
Association between triglyceride-glucose-body mass index and adverse prognosis in elderly patients with severe heart failure and type 2 diabetes: a retrospective study based on the MIMIC-IV database.Cardiovasc Diabetol. 2025 Jul 24;24(1):299. doi: 10.1186/s12933-025-02870-x. Cardiovasc Diabetol. 2025. PMID: 40707996 Free PMC article.
-
Differential impact of TyG and TyG-BMI indices on short- and long-term mortality in critically ill ischemic stroke patients.BMC Cardiovasc Disord. 2024 Dec 30;24(1):754. doi: 10.1186/s12872-024-04450-5. BMC Cardiovasc Disord. 2024. PMID: 39734194 Free PMC article.
-
Association of Triglyceride-Glucose (TyG) Index With Severe Acute Pancreatitis: A Systematic Review and Meta-Analysis.Cureus. 2025 May 9;17(5):e83795. doi: 10.7759/cureus.83795. eCollection 2025 May. Cureus. 2025. PMID: 40486349 Free PMC article. Review.
Cited by
-
Evaluating the impact of metabolic indicators and scores on cardiovascular events using machine learning.Diabetol Metab Syndr. 2025 May 30;17(1):180. doi: 10.1186/s13098-025-01753-1. Diabetol Metab Syndr. 2025. PMID: 40442740 Free PMC article.
References
-
- Savarese, G. et al. Global burden of heart failure: a comprehensive and updated review of epidemiology. Cardiovasc. Res.118, 3272–3287 (2023). - PubMed
-
- Wang, H. et al. Prevalence and incidence of heart failure among urban patients in China: A National population-based analysis. Circulation Heart Fail.14, e008406 (2021). - PubMed
-
- Zhang, Y. et al. High triglyceride-glucose index is associated with adverse cardiovascular outcomes in patients with acute myocardial infarction. Nutr. Metab. Cardiovasc. Dis.30, 2351–2362 (2020). - PubMed
-
- Marsico, F., Gargiulo, P., Marra, A. M., Parente, A. & Paolillo, S. Glucose metabolism abnormalities in heart failure patients: insights and prognostic relevance. Heart Fail. Clin.15, 333–340 (2019). - PubMed
MeSH terms
Substances
Grants and funding
LinkOut - more resources
Full Text Sources
Medical
Research Materials
Miscellaneous
