. 2025 May 9;15(1):16200.
doi: 10.1038/s41598-025-00206-z.

GIS-based integration of marine data for assessment and management of a highly anthropized coastal area

Affiliations

GIS-based integration of marine data for assessment and management of a highly anthropized coastal area

Luciano Bosso et al. Sci Rep. .

Abstract

Monitoring coastal marine environments by evaluating and comparing their chemical, physical, biological, and anthropogenic components is essential for ecological assessment and socio-economic development. In this study, we conducted an integrated multivariate analysis to assess the descriptors of the Marine Strategy Framework Directive at a regional scale in the Tyrrhenian Sea (Italy), with a specific focus on the densely populated coastal zone of the Campania region. Physical, chemical, and biological data were collected and analyzed in 22 sampling sites during three oceanographic surveys in the Gulf of Gaeta (GoG), Naples (GoN), and Salerno (GoS) in autumn 2020. Our results indicated that these three gulfs were distinct overall, with GoN being more divergent and heterogeneous than GoG and GoS. The marine area studied in the GoN had more favorable hydrographic and trophic conditions and food web characteristics, except for the mesozooplankton biomass, and was closer to socio-economic factors compared to the GoS and GoG. Our analysis helped us find the key ecological features that define different sub-regions and connect them to social and economic factors, including human activities. We highlighted the relevance of primary and secondary variables in terms of the comprehensive ecological assessment of a marine area and its impact on specific socio-economic activities. These findings support the need to describe and integrate multiple descriptors at the spatial scale.

Keywords: Campania region; Ecological assessment; Geographic information system; Good environmental status descriptors; Marine spatial planning; Marine strategy framework directive; Mediterranean basin; Spatial analysis.


Conflict of interest statement

Declarations. Competing interests: The authors declare no competing interests.

Figures
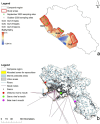
Fig. 1
Fig. 1
Study areas (red lines) and sampling sites (green and white points) in the two sampling months of 2020 (a) and a map of the Campania Region with urban areas, the three rivers’ mouths, Marine Protected Areas (MPAs), Allocated Zones for Aquaculture (AZAs), drains, and main naval routes (b). These maps are high-resolution; please zoom in to view more details. To optimise the display of AZAs, MPAs, and drains, we have included more thorough maps for these layers in the supplementary materials (Figure S1). These maps were generated in ArcGIS v. 10.8 (https://www.esri.com/en-us/home).
Fig. 2
Fig. 2
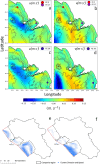
Mean value of u (v) velocity field component in September 2009 evaluated in the sampling stations FE3 and FE17 (Gulf of Gaeta and Gulf of Naples, respectively). Gulf of Naples Advanced Model (GNAM) data (ab). The mean value of the u (v) velocity field component in October 2009 was evaluated in the sampling stations FE26 (Gulf of Salerno) GNAM model data (cd). Surface current field along the Campania coast during the sampling dates in September (e) and October (f) 2020, Copernicus Marine Environment Monitoring Service data. These maps were generated in ArcGIS v. 10.8 (https://www.esri.com/en-us/home).
Fig. 3
Fig. 3
Spatial distribution of physical variables for the Gulf of Gaeta (GoG), Gulf of Naples (GoN), and Gulf of Salerno (GoS) in the Campania Region. The panels are as follows: temperature (a), salinity (b), fluorescence (c), and dissolved oxygen (d). Note that numerical scales are different in each map. These maps are high-resolution; please zoom in to view more details. These maps were generated in ArcGIS v. 10.8 (https://www.esri.com/en-us/home).
Fig. 4
Fig. 4
Spatial distribution of chemical variables in the Gulf of Gaeta (GoG), Gulf of Naples (GoN), and Gulf of Salerno (GoS) in the Campania Region. The panels are as follows: total dissolved nitrogen (a), dissolved inorganic nitrogen (b), particulate organic carbon (c), phosphate (d), silicate (e), and microplastic items (f). Note that numerical scales are different in each map. These maps are high-resolution; please zoom in to view more details. These maps were generated in ArcGIS v. 10.8 (https://www.esri.com/en-us/home).
Fig. 5
Fig. 5
Spatial distribution of biological variables in the Gulf of Gaeta (GoG), Gulf of Naples (GoN), and Gulf of Salerno (GoS) in the Campania Region. The panels are as follows: total chlorophyll a (a), heterotrophic bacteria concentrations (b), phytoplankton carbon biomass (c), Pseudo-nitzschia carbon biomass (d), protozooplankton carbon biomass (e), and mesozooplankton carbon biomass (f). Note that numerical scales are different in each map. These maps are high-resolution; please zoom in to view more details. These maps were generated in ArcGIS v. 10.8 (https://www.esri.com/en-us/home).
Fig. 6
Fig. 6
The Principal Component Analysis (PCA) of data retrieved in the Gulf of Gaeta (GoG, blue points), the Gulf of Naples (GoN, green triangles), and the Gulf of Salerno (GoS, red squares) is shown in Fig. 1. a = PCA all variables together, including distances from the Allocated Zones for Aquaculture, drains, Marine Protected Areas, naval routes, and river mouths; b = PCA physical variables; c = PCA chemical variables; d = biological variables.
Fig. 7
Fig. 7
Network visualisation of the spatial correlation among observed variables (both sampled and socio-economical) on the Campania coast. Network nodes and edges are variables and correlations among them, respectively. Node size is proportional to the node’s Degree, that is, the number of correlations it establishes. Edge thickness is proportional to the correlation value. Only statistically significant correlations are presented. Red and blue lines are network edges indicating negative and positive correlations, respectively. The acronyms are as follows: AZA = Allocated zone for aquaculture; Bact = Heterotrophic bacteria; Chl = Total chlorophyll a; CurD = Current direction; CurS = Current speed; DIN = Dissolved inorganic nitrogen; Dra = Drain; Fluo = Fluorescence; MPA = Marine protected area; Mzoo = Mesozooplankton; Nav = Naval route; Oxy = Dissolved oxygen; Phy = Phytoplankton; PN = Pseudo-nitzschia; PO4 = Phosphate; POC = Particulate organic carbon; Pzoo = Protozooplankton; Riv = River; Sal = Salinity; SiO2 = Silicate; TDN = Total dissolved nitrogen; Temp = Temperature; Urb = Urban area.

Similar articles

References

    1. Livingston, R. J. Trophic organization in coastal systems. CRC Press (2002).
    1. He, Q. & Silliman, B. R. Climate change, human impacts, and coastal ecosystems in the anthropocene. Curr. Biol.29, R1021–R1035 (2019). - PubMed
    1. Selig, E. R. et al. Mapping global human dependence on marine ecosystems. Conserv. Lett.12, e12617 (2019).
    1. Halpern, B. S. et al. A global map of human impact on marine ecosystems. Science319, 948–952 (2008). - PubMed
    1. D’Alelio, D., Russo, L., Hay Mele, B. & Pomati, F. Intersecting ecosystem services across the aquatic continuum: From global change impacts to local, and biologically driven, synergies and trade-offs. Front. Ecol. Evol.9, 628658 (2021).

LinkOut - more resources