. 2025 May 9;16(1):369.
doi: 10.1038/s41419-025-07662-5.

Short-chain polyphosphates induce tau fibrillation and neurotoxicity in human iPSC-derived retinal neurons

Affiliations

Short-chain polyphosphates induce tau fibrillation and neurotoxicity in human iPSC-derived retinal neurons

Lorenzo Barolo et al. Cell Death Dis. .

Abstract

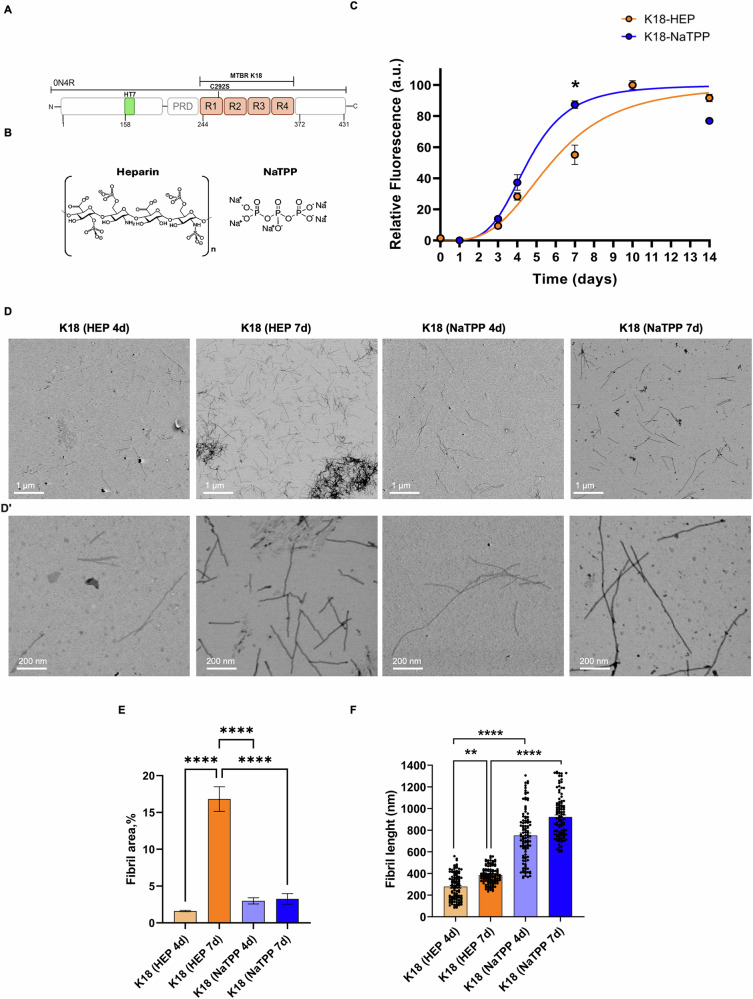
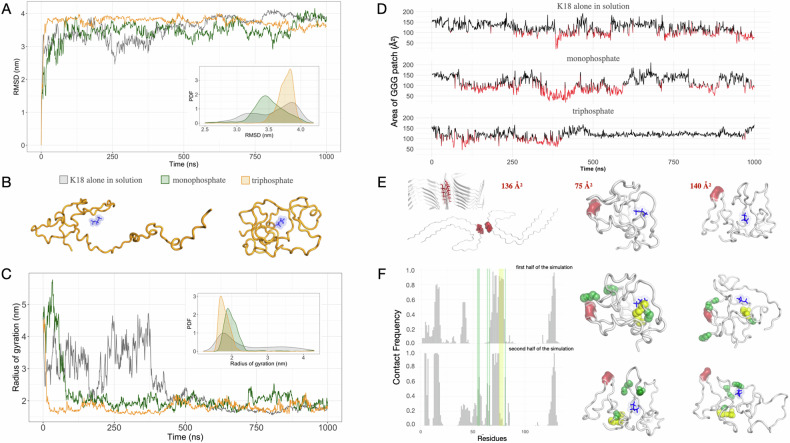
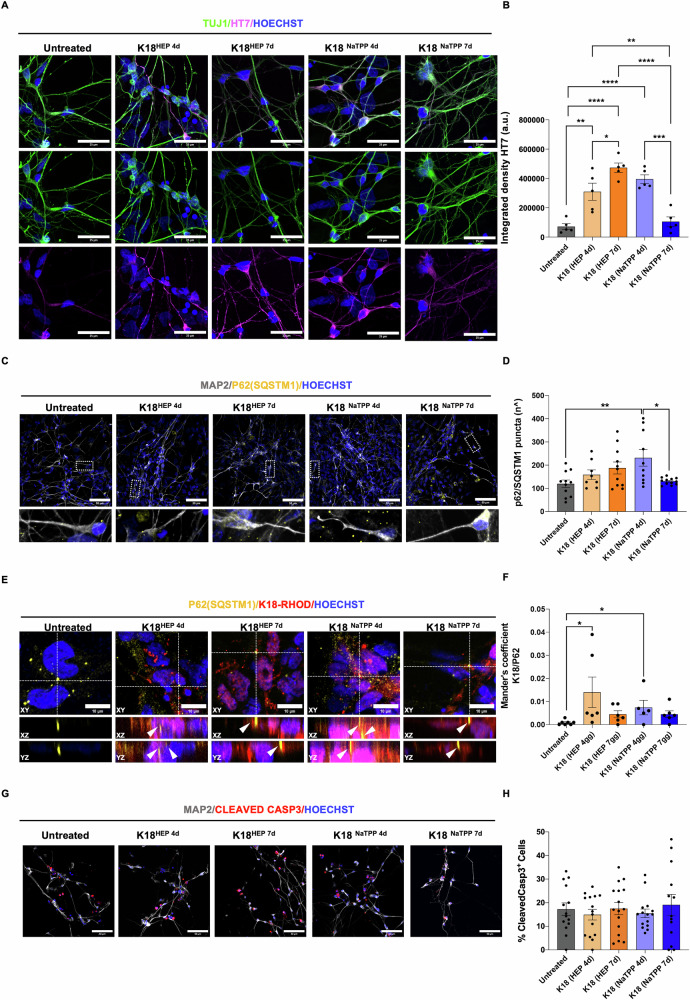
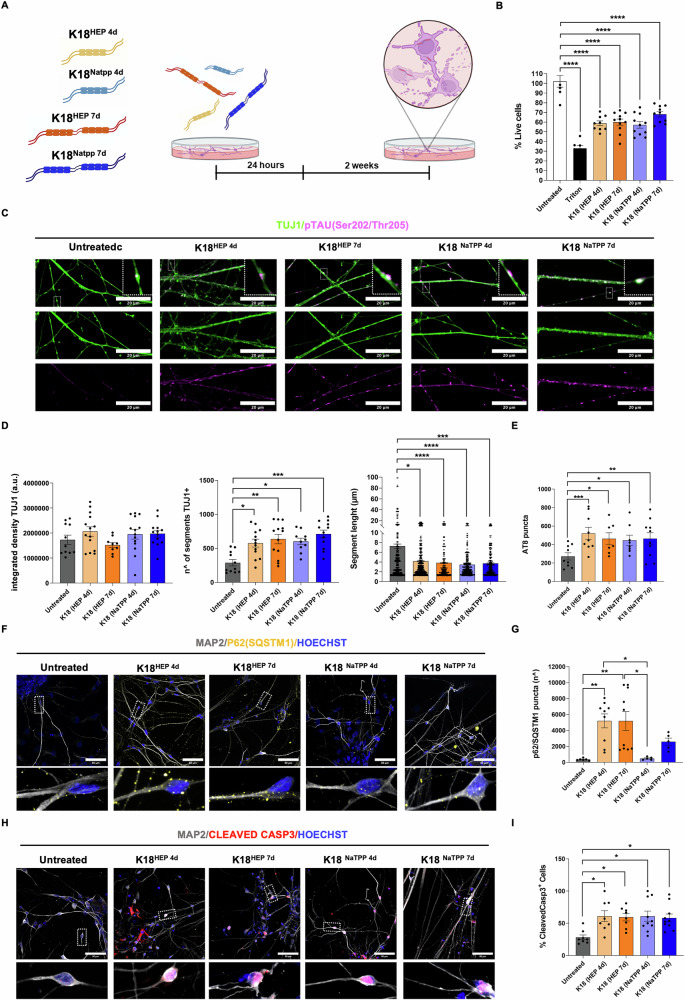
The onset of Alzheimer's Disease and Frontotemporal Dementia is closely associated with the aggregation of tau, a multifunctional protein essential for neuronal stability and function. Given the role of tau aggregation in neurodegeneration, understanding the mechanisms behind its fibril formation is crucial for developing therapeutic interventions to halt or reverse disease progression. However, the structural complexity and diverse aggregation pathways of tau present significant challenges, requiring comprehensive experimental studies. In this research, we demonstrate that short-chain polyphosphates, specifically sodium tripolyphosphate (NaTPP), effectively induce tau fibril formation in vitro using the microtubule-binding domain fragment (K18). NaTPP-induced fibrils display unique structural characteristics and aggregation kinetics compared to those induced by heparin, indicating distinct pathogenic pathways. Through molecular dynamics simulations, we show that NaTPP promotes aggregation by exposing key residues necessary for fibril formation, which remain concealed under non-aggregating conditions. This interaction drives tau into an aggregation-prone state, revealing a novel mechanism. Furthermore, our study indicates that human pluripotent stem cell-derived retinal neurons internalize NaTPP-induced fibrils within 24 h, pointing to a potential pathway for tau spread in neurodegeneration. To explore the translational implications of NaTPP-induced fibrils, we assessed their long-term effects on cellular viability, tubulin integrity, and stress responses in retinal neuron cultures. Compared to heparin, NaTPP promoted fewer but longer fibrils with initially low cytotoxicity but induced a stress response marked by increased endogenous tau and p62/SQSTM1 expression. Prolonged exposure to NaTPP-induced oligomers significantly increased cytotoxicity, leading to tubulin fragmentation, altered caspase activity, and elevated levels of phosphorylated pathological tau. These findings align with a neurodegenerative phenotype, highlighting the relevance of polyphosphates in tau pathology. Overall, this research enhances our understanding of the role of polyphosphate in tau aggregation, linking it to key cellular pathways in neurodegeneration.


Conflict of interest statement

Competing interests: The funders had no role in the study design, in the collection, analysis, or interpretation of data, in the writing of the manuscript, or in the decision to publish the results. YG is employed by D-Tails s.r.l.; SDA is a scientific advisor of D-Tails s.r.l. The remaining authors declare that the research was conducted without any commercial or financial relationships that could be construed as a potential conflict of interest. Ethics approval and consent to participate: The use of hiPSC has been approved by the Ethical Committee for Translational Research (CERT) Sapienza University (Aut. n. 5/2022). This study does not involve animal or human participants, therefore, obtaining informed consent for participation and publication is not applicable. All methods were performed in accordance with the relevant guidelines and regulations.

Figures

Fig. 1
Fig. 1. Kinetics of aggregation and structural characterization over time of K18 domain with heparin and NaTPP cofactors.
A Schematic view of the full-length form of protein tau (0N4R). Recombinant K18 domain from 244-372 and the mutation C249S are shown. HT7 recognition site is also indicated in green; B Chemical structures of anionic compounds used in the same ratio 1:1 = protein:cofactor; C Representative plot showing the fibril formation using BT1 fluorescence as a function of time in the presence of non-fibrillated K18, 100 µM, and fibrillated K18-Hep, 100 µM (orange curve) and K18-NaTPP 100 µM (blue curve) at 37 °C at different time points. All spectra were obtained using a λex = 530 nm, λem = 565 nm. All data are mean ± SEM, n = 3, two-way ANOVA and Sidak’s multiple comparisons post hoc test *p < 0.05; Representative STEM images of negative stained K18 fibrils, at lower (D) and higher (D’) magnification (scale bars 1 μm and 200 nm, respectively). The fibrils were formed with heparin after 4 days (i) and 7 days (ii), and with NaTPP after 4 days (iii) and 7 days (iv); E measurement of population distribution of fibrils in all four samples calculated from STEM images (All data are mean ± SEM, n=FOV = 3, one-way ANOVA and Tukey’s multiple comparisons post hoc test ****p < 0.0001); F measurement of average length of K18 fibrils in all four samples calculated from STEM images (All data are mean ± SEM, n = 50, Kruskal Wallis and Dunn’s multiple comparisons post hoc test **p < 0.01, ****p < 0.0001).
Fig. 2
Fig. 2. Molecular dynamics simulations analysis.
A For each of the three simulated systems (K18 in water in gray, K18 with NaP, in green, and K18 with NaTPP, in orange), the RMSD values as a function of time are reported. Additionally, the probability density functions (PDF) of the RMSD values related to the three systems are shown in the inset. B Two cartoon representations of two snapshots from the K18 with NaTPP simulation are shown, one with high (less compact form) and one with low radius of gyration (more compact form). C Radius of gyration values as a function of time with the corresponding probability density functions in the inset. D For each simulated system, we report the surface area of the molecular surface patch formed by the three consecutive glycine residues directly involved in the fibril interface, whose structure is experimentally known. The surface area value, calculated by summing the contributions of the selected residues’ areas, is shown for each frame of the three molecular dynamics simulations. In black are the surface area values greater than 100 Ų (more exposed residues) and in red are the surface area values less than 100 Ų (less exposed residues). E On the left is a cartoon representation of the TAU fibril (PDB code 5O3L), with a focus on a single layer of the fibril itself, where the solvent-accessible area of the two sets of three interacting glycines is shown in red. On the right are two cartoon representations of different simulation snapshots: one where the area of the three glycines is below the threshold, and one where the area is above the threshold, showing greater exposure. F On the left are the relative contact frequencies between each residue of the K18 protein and the monophosphate molecule. The top barplot corresponds to the first half of the simulation, and the bottom barplot corresponds to the second half of the simulation. On the right are snapshots of the K18 with NaTPP simulation: two snapshots from the first half of the simulation (where the residues shown in green interact with the three glycines involved in the fibril interface) and two snapshots from the second half of the simulation (where the same residues shown in green interact with the ligand). In yellow are the residues interacting with the ligand only in the first part of the simulation.
Fig. 3
Fig. 3. Short-term effects of tau fibrils on iPSC-derived retinal neurons.
A Confocal immunostaining for total tau HT7 (magenta) and neurite marker β-III-tubulin TUJ1 (green). Nuclei were stained with HOECHST (blue). Scale bar 25 μm; B Bar graph represents the integrated density of total tau in retinal neurons 24 hours after K18-tau seeding (n=FOV = 15, one way ANOVA and Tukey’s multiple comparisons post hoc test: K18-Hep-4d VS Untreated p = 0.0015, K18-Hep-7d VS Untreated p < 0.0001, K18-NaTPP-4d VS Untreated p < 0.0001, K18-Hep-4d VS K18-Hep-7d p = 0.0357, K18-NaTPP-4d VS K18-NaTPP-7d p = 0.0002, K18-Hep-4d VS k18-NaTPP-7d p = 0.0065, K18-Hep-7d VS K18-NaTPP-7d p < 0.0001; C Representative confocal images of retinal neurons immunostained with MAP2 (gray), p62/SQSTM1 (yellow) and HOECHST to stain nuclei (blue). Scale bar 50 µm. Zoomed images show p62 puncta within MAP2 positive neurite; D Quantification of p62/SQSTM1 puncta. (n=FOV = 15, one-way ANOVA and Tukey’s multiple comparisons post hoc test: K18-NaTPP-4d VS Untreated p = 0.0074, K18-NaTPP-4d VS K18-NaTPP-7d p = 0.0162); E K18-seed was conjugated with rhodamine (red) and p62/SQSTM1 puncta (yellow) that co-localize with K18 fibrils are highlighted with arrow; Scale bar 10 µm; F Bar charts showing the Mander’s colocalization coefficient of k18-fibrils and p62/SQSTM1 in untreated and treated retinal neurons. (n=FOV = 6, Kruskal Wallis and Dunn’s multiple comparisons post hoc test: K18-Hep-4d VS Untreated p = 0.0177, K18-NaTPP-4d VS Untreated p = 0.0493); G Representative confocal images of iPSC-derived retinal neurons stained with MAP2 (gray), CLEAVED-CASPASE 3 (red) and HOECHST (blue). Scale bar 50 µm; H Bar graph represents the percentage of cleaved-caspase 3 positive nuclei normalized to the total number of nuclei. (n=FOV = 15, Kruskal–Wallis test, and Dunn’s multiple comparison post hoc test).
Fig. 4
Fig. 4. Long-term effects of tau fibrils on iPSC-derived retinal neurons.
A Schematic representation of the experimental plan used to evaluate the long-term effect of K18 fibrils in hiPSC-derived retinal neurons. DIV 30 retinal neurons were treated with K18-Hep-4d, K18-NaTPP-4d, K18-Hep-7d, and K18-NaTPP-7d for 24 hours. Two weeks after treatment confocal microscopy experiments were performed in live imaging or after fixation Created with Biorender.com; B Bar charts show the effect of different K18 fibrils on cell survival. Significant differences are reported compared to the positive control (n=FOV = 9, One-way ANOVA and Tukey’s multiple comparisons post hoc test: K18-Hep-4d VS Untreated p < 0.0001, K18-Hep-7d VS Untreated p < 0.0001, K18-NaTPP-4d VS Untreated p < 0.0001, K18-NaTPP-7d VS Untreated p < 0.0001); C Immunostaining for neurite marker β-III-tubulin TUJ1 (green) and phospho-tau (Ser202, Thr205) (AT8, magenta) two weeks after exposure to K18 fibrils. Scale bar 20 µm; D Bar graphs represent the integrated signal density of TUJ1 (left panel, n=FOV = 9–14, Kruskal Wallis test and Dunn’s multiple comparisons post hoc test (ns), the number (middle panel, n=FOV = 10-13, Kruskal Wallis and Dunn’s multiple comparisons post hoc test: K18-Hep-4d VS Untreated p = 0.0208, K18-Hep-7d VS Untreated p = 0.0025, K18-NaTPP-4d VS Untreated p = 0.0149, K18-NaTPP-7d VS Untreated p = 0.0002); and the length (right panel, n = 103–117 segments, Kruskal Wallis and Dunn’s multiple comparisons post hoc test: K18-Hep-4d VS Untreated p = 0.0451, K18-Hep-7d VS Untreated p < 0.0001, K18-NaTPP-4d VS Untreated p < 0.0001, K18-NaTPP-7d VS Untreated p = 0.0003) of TUJ1 segments in retinal neurons; E Bar graph represent the puncta number of AT8 (p-tau Ser202-Thr205) (n=FOV = 15, one-way ANOVA and Sidak’s multiple comparisons post hoc test: K18-Hep-4d VS Untreated p = 0.0002, K18-Hep-7d VS Untreated p = 0.0138, K18-NaTPP-4d VS Untreated p = 0.0242, K18-NaTPP-7d VS Untreated p = 0.0046); F Representative confocal images of retinal neurons immunostained with p62/SQSTM1 (yellow) and neurite marker MAP2 (gray). Nuclei were stained with HOECHST (blue). Scale bar 50 µm. Zoomed images show p62 puncta within MAP2 positive neurite; G Quantification of p62/SQSTM1 puncta (n=FOV = 15, Kruskal Wallis and Dunn’s multiple comparisons post hoc test: K18-Hep-4d VS Untreated p = 0.0033, K18-Hep-7d VS Untreated p = 0.0019); H Representative confocal images of iPSC-derived retinal neurons stained with MAP2 (gray), CLEAVED-CASPASE 3 (red) and HOECHST (blue). Scale bar 50 µm; Zoomed images show cleaved-caspase 3 positive nuclei in retinal neurons; I Bar graph represents the percentage of cleaved-caspase 3 positive nuclei in retinal neurons, normalized to the total number of nuclei. Significant differences are reported compared to the control (n=FOV = 15, One-way ANOVA and Tukey’s multiple comparisons post hoc test: K18-Hep-4d VS Untreated p = 0.0174, K18-Hep-7d VS Untreated p = 0.0271, K18-NaTPP-4d VS Untreated p = 0.0115, K18-NaTPP-7d VS Untreated p = 0.0242).

Similar articles

Cited by

References

    1. Binder LI, Frankfurter A, Rebhun LI. The distribution of tau in the mammalian central nervous system. J Cell Biol. 1985;101:1371–8. - PMC - PubMed
    1. Chang CW, Shao E, Mucke L. Tau: Enabler of diverse brain disorders and target of rapidly evolving therapeutic strategies. Science. 2021;371:eabb8255. - PMC - PubMed
    1. Goedert M, Jakes R, Spillantini MG, Hasegawa M, Smith MJ, Crowther RA. Assembly of microtubule-associated protein tau into Alzheimer-like filaments induced by sulphated glycosaminoglycans. Nature. 1996;383:550–3. - PubMed
    1. Hernández F, Ferrer I, Pérez M, Zabala JC, Del Rio JA, Avila J. Tau aggregation. Neuroscience. 2023;518:64–9. - PubMed
    1. Goedert M. Tau filaments in neurodegenerative diseases. FEBS Lett. 2018;592:2383–91. - PubMed

MeSH terms

LinkOut - more resources