. 2025 May 9;16(1):4318.
doi: 10.1038/s41467-025-59601-9.

Ectoparasites enhance survival by suppressing host exploration and limiting dispersal

Affiliations

Ectoparasites enhance survival by suppressing host exploration and limiting dispersal

Pengbo Liu et al. Nat Commun. .

Abstract

Parasites enhance their fitness by manipulating host dispersal. However, the strategies used by ectoparasites to influence host movement and the underlying mechanisms remain poorly understood. Here, we show that ectoparasites alter metabolic activity in specific brain regions of mice, with evidence pointing to a potential role for microglial activation in the prefrontal cortex. This activation appears to contribute to synaptic changes and altered neuronal differentiation, particularly in GABAergic neurons. Consequently, exploratory behavior decreases-an effect likely mediated through the skin-brain axis. In both indoor and field experiments with striped hamsters, ectoparasites reduce host exploration and modify their dispersal patterns. This behavioral shift ultimately restricts the host's distribution, enabling parasites to avoid environmental pressures. Our findings reveal that ectoparasites limit host dispersal to improve their own fitness, offering key insights for parasite control strategies that promote health and preserve ecological stability within the One Health framework.


Conflict of interest statement

Competing interests: The authors declare no competing interests.

Figures

Fig. 1
Fig. 1. Schematic diagrams of the experiment design in this study, created in BioRender.
Liu, P. (2025) https://BioRender.com/t7hic5v. a Three female mice were housed per cage and allowed to acclimate for one week. Flea infection was initiated by introducing 150 live fleas (X. cheopis) into each cage in the Flea+ group, while the Flea− group received the same number of heat-killed fleas as a control. Each week, remaining fleas were removed, and 150 new fleas were reintroduced to maintain infection. After four weeks of continuous infection, behavioral and molecular assays were conducted to test the hypothesis that ectoparasites reduce host exploratory behavior and to investigate the underlying neuro-molecular mechanisms. b Striped hamsters captured from the wild were acclimated to laboratory conditions for one month before flea infection. The fleas used for infection were derived from a wild population naturally infecting striped hamsters. Hamsters were housed individually at night and exposed to fleas in glass tanks during the day. After four weeks of infection, behavioral experiments were performed to assess changes in exploratory behavior. c Six 30 m × 30 m field enclosures were constructed to conduct three rounds of flea infection experiments, each lasting four weeks. In the first round, only striped hamsters were introduced. In the second round, fleas were added to a subset of enclosures, and in the third round, fleas were introduced to all enclosures. After each round, hamsters were recaptured, and their exploratory behavior was evaluated based on capture rates. d Using dispersal data from the experiments, combined with demographic data and habitat suitability maps, the RangeShiftR model was employed to simulate the impact of flea-induced reductions in exploratory behavior on the distribution and range dynamics of striped hamsters.
Fig. 2
Fig. 2. Flea bites reduce mice’s exploratory behavior and alter brain metabolic patterns.
a Open field test results shown as a boxplot: Flea− (red, n = 12) and Flea+ (blue, n = 12). One-sided t test was used. Flea+ mice exhibited reduced time in the central area (left) and fewer entries into the central area (right) compared to Flea− mice. Thick bars indicate the interquartile range (IQR) around the median, and whiskers represent 1.5 times the interquartile range (maxima: Q3 + 1.5 × IQR, minima: Q1−1.5 × IQR). Each black dot represents an individual. Asterisks indicate the significance. b Elevated plus maze results shown as a boxplot: Flea− (red, n = 8) and Flea+ (blue, n = 8). One-sided t test was used. Flea+ mice spent less time in the open arms compared to Flea− mice. Thick bars indicate the interquartile range (IQR) around the median, and whiskers represent 1.5 times the interquartile range (maxima: Q3 + 1.5 × IQR, minima: Q1−1.5 × IQR). Each black dot represents an individual. Asterisks indicate the significance. c Spearman correlation of 18F-FDG uptake between brain regions in the Flea− group (n = 6) and Flea+ group (n = 3). Two-sided t test was used. d 3D rendering of SPM-based voxel-level statistical analysis overlaid on an MR template image. Blue indicates hypometabolic regions in the Flea+ group, while red indicates hypermetabolic regions. Statistically significant clusters are marked in the figure. e Bar graph showing brain regions with significant differences in18F-FDG uptake between the Flea− (red, n = 6) and Flea+ (blue, n = 3) groups. Two-sided t test was used. Each black dot represents an individual. Asterisks indicate brain regions with significant differences. Data are presented as mean ± SEM. fh Representative images of selected axial slices after spatial normalization. ARA standardized coordinates are indicated. PET brain activity is scaled to the cerebral global mean, with identical window/level settings applied to all animals. Source data are provided as a Source Data file. **p < 0.01, *p < 0.05.
Fig. 3
Fig. 3. Flea bites alter the expression patterns in the prefrontal cortex.
a Principal component analysis of all transcriptome data showing tight clustering of brain regions. b Differential gene analysis revealed the number of differentially expressed genes in the three tested brain regions, using one-way ANOVA. c GSEA analysis of transcriptomic data from three brain regions showed that the PFC was enriched with the most neural function-related pathways, supporting that flea bites have the greatest impact on PFC function. d KEGG pathway enrichment analysis of differential neurotransmitters in the PFC. Fisher’s Exact Test was used. e Neurotransmitters related to synthesizing dopamine, norepinephrine, and serotonin all showed intergroup differences based on PET-CT for Flea− (n = 6) and Flea+ (n = 3) groups; Thick bars indicate the interquartile range (IQR) around the median, and whiskers represent 1.5 times the interquartile range (maxima: Q3 + 1.5 × IQR, minima: Q1 − 1.5 × IQR). Data are presented as mean ± SEM. f Cell-specific enrichment analysis based on DEGs from the transcriptomic data of three brain regions: p-value < 0.05 in red. Fisher’s Exact Test was used. g Schematic of microglial cells in resting and activated states, created in BioRender. Liu, P. (2025) https://BioRender.com/lrddnmc. h Representative flow cytometry plots of the PFC from the Flea− and Flea+ group. i Comparison of activated microglial cells between groups in the PFC using quantitative flow cytometry. Two-sided t test was used. Red represents the Flea− group (n = 6), and blue represents the Flea+ group (n = 6). Each black dot represents an individual. Asterisks indicates brain regions with significant differences. Data are presented as mean ± SEM. j Representative images of brain sections stained with IBA1 from Flea− and Flea+ mice; Scale 50 µm. k Comparison of IBA1 protein fluorescence intensity in brain sections between the Flea− (red, n = 5) and Flea+ (blue, n = 5) groups of mice. Two-sided t test was used. Each black dot represents an individual. Asterisks indicates brain regions with significant differences. Data are presented as mean ± SEM. l Western blot images of IBA1 protein expression in the PFC of mice from the Flea− and Flea+ groups. Source data are provided as a Source Data file. **p < 0.01, *p < 0.05.
Fig. 4
Fig. 4. Flea bites cause neuronal damage in the PFC and a reduction in GABAergic neurons.
a Representative images of brain sections from Flea− and Flea+ mice; NeuN (red) and TUNEL (green). Scale 50 µm. b Comparison of mature neurons in brain sections between the Flea− (red, n = 5) and Flea+ (blue, n = 5) groups of mice. Two-sided t test was used. Asterisks indicates brain regions with significant differences. Data are presented as mean ± SEM. c Comparison of cell apoptosis in brain sections between the Flea− (red, n = 5) and Flea+ (blue, n = 5) groups of mice. Two-sided t test was used. Asterisks indicates brain regions with significant differences. Data are presented as mean ± SEM. d Representative images of brain sections from Flea− and Flea+ mice; PSD95 (left), Homer1 (mid), and Syn (right). Scale 50 µm. eg Comparison of synaptic structure: PSD95 (e), Homer1 (f), and Syn (g) between the Flea− (red, n = 5) and Flea+ (blue, n = 5) groups of mice. Two-sided t test was used. Asterisks indicates brain regions with significant differences. Data are presented as mean ± SEM; Scale 50 µm. h Representative transmission electron microscopy images.; Scale 500 nm (left) and 200 nm (right). Synaptic gaps between neurons are indicated by red arrows. i Western blot images of GAD65/67 expression in the PFC of mice from the Flea− and Flea+ groups. j Representative images of brain sections from Flea− and Flea+ mice; GAD65/67 (left), GABAaRγ2 (mid) and VGLuT1(right). Scale 50 µm. km Comparison of synaptic structure: GAD65/67 (j), GABAaRγ2 (k), and VGLuT1 (l) between the Flea− (red, n = 5) and Flea+ (blue, n = 5) groups of mice. Two-sided t test was used. Each black dot represents an individual. Asterisks indicates brain regions with significant differences. Data are presented as mean ± SEM. n Differences in GABAergic neuron expression levels between Flea− and Flea+ after controlling for glutamatergic neuron expression levels (Flea− n = 5, Flea+ n = 5). Two-sided t test was used. Asterisks indicates brain regions with significant differences. Data are presented as mean ± SEM. Source data are provided as a Source Data file. ***p < 0.001, **p < 0.01, *p < 0.05.
Fig. 5
Fig. 5. Flea bites affect neural function through the skin-brain axis.
a GSEA result on upregulated genes from the mice skin transcriptome. Functions related to immunoglobulin and hemoglobin genes are significantly enriched. b Cytokine levels in mice skin presented in boxplot where red is Flea− (n = 6/12) and blue is Flea+ (n = 6/12). Two-sided t test was used. Asterisks indicate the significance. All p-values were below 0.001. c Cytokine levels in mice serum presented in boxplot where red is Flea− (n = 12) and blue is Flea+ (n = 12). Two-sided t test was used. Thick bars indicate the interquartile range (IQR) around the median, and whiskers represent 1.5 times the interquartile range (maxima: Q3 + 1.5 × IQR, minima: Q1 − 1.5 × IQR). Asterisks indicate the significance. All p-values were below 0.001. d Cytokine levels in mice PFC presented in boxplot where red is Flea− (n = 10) and blue is Flea+ (n = 10). Two-sided t test was used. Asterisks indicate the significance. All p-values were below 0.001. e Representative HE plots of the PFC. In the Flea+ group, cortical tissue shows evident cellular damage, with minor mononuclear cell infiltration (yellow arrow) at the injury site. Additionally, widespread nuclear pyknosis and condensation (red arrow) are observed in the parenchyma. The infected group exhibits a larger area of damage; Scale 50 µm. f Western blot analysis of Claudin1 markers of tight junction protein from the PFC brain region (n = 5 samples each group). g Comparison of Claudin1 in WB between the Flea− (red, n = 5) and Flea+ (blue, n = 5) groups of mice. Two-sided t test was used. Each black dot represents an individual. Asterisks indicates brain regions with significant differences. Data are presented as mean ± SEM. Source data are provided as a Source Data file. h Validation by qPCR of select BBB genes altered between Flea− (n = 3) and Flea+ (n = 3) group. Two-sided t test was used. Thick bars indicate the interquartile range (IQR) around the median, and whiskers represent 1.5 times the interquartile range (maxima: Q3 + 1.5 × IQR, minima: Q1 − 1.5 × IQR). Each black dot represents pooled sample of 3 decapitated individuals. Asterisks indicate the significance. ***p < 0.001, **p < 0.01, *p < 0.05.
Fig. 6
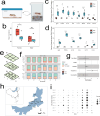
Fig. 6. Striped hamsters exposed to flea bites exhibited reduced exploratory behavior in both indoor infection and outdoor enclosure experiments.
a Schematic diagram of laboratory infection in striped hamsters, created in BioRender. Liu, P. (2025) https://BioRender.com/ps1cm2y. b Open field test for striped hamster, n = 5 each group, tested using a Generalized Linear Model (GLM). Thick bars indicate the interquartile range (IQR) around the median, and whiskers represent 1.5 times the interquartile range (maxima: Q3 + 1.5 × IQR, minima: Q1 − 1.5 × IQR). Each black dot represents an individual. Asterisks indicate the significance. (Pfemale = 0.03, Pmale = 0.26). c Cytokine levels in striped hamster skin presented in boxplot where red is Flea− (n = 3–7) and blue is Flea+ (n = 7–9). Two-sided t test was used. Thick bars indicate the interquartile range (IQR) around the median, and whiskers represent 1.5 times the interquartile range (maxima: Q3 + 1.5 × IQR, minima: Q1 − 1.5 × IQR). Each black dot represents an individual. Asterisks indicate the significance. d Cytokine levels in striped hamster serum presented in boxplot where red is Flea− (n = 5) and blue is Flea+ (n = 5). Two-sided t test was used. Thick bars indicate the interquartile range (IQR) around the median, and whiskers represent 1.5 times the interquartile range (maxima: Q3 + 1.5 × IQR, minima: Q1 − 1.5 × IQR). Each black dot represents an individual. Asterisks indicate the significance. e Schematic diagram of the three rounds of enclosure field experiments under natural conditions. f Bar graph of the capture rate of striped hamsters released into the enclosures. g Forest plot illustrating that Flea+ (n = 72) striped hamsters had a significantly higher escape rate than Flea− (n = 62) hamsters, tested using a generalized linear mixed model (GLMM). The x-axis represents the coefficients of various predictor variables. Solid circles indicate statistically significant results, while hollow circles represent non-significant results. Data are presented as mean values ± SEM. h Field sampling sites for striped hamsters, selected based on temperature and precipitation gradients. Created using the open-source R packages ggplot2 (MIT License). i The number of striped hamsters captured during each sampling event at each site, with no capture records for striped hamsters at site N5. Source data are provided as a Source Data file. ***p < 0.001, **p < 0.01, *p < 0.05.
Fig. 7
Fig. 7. The suitable habitat distribution of striped hamsters is based on species distribution modeling.
These figures were created using the open-source R packages bomod2 and ggplot2, both licensed under the MIT License. a Actual distribution points and pseudo-absence points for striped hamsters. b Evaluation of prediction performance for 11 models in the Biomod2 package, based on TSS and ROC metrics. c Habitat suitability distribution for striped hamsters in China under future climate scenarios. d Changes in habitat suitability for striped hamsters in China under future climate scenarios. e Suitable habitat distribution of striped hamsters in China and the selection of three simulated sites. fh Changes in habitat suitability index for striped hamsters over 100 years at three sites used for mechanistic modeling: S1 ((f), high suitability with stable index), S2 ((g), moderate suitability with decreasing index), and S3 ((h), moderate suitability with increasing index).
Fig. 8
Fig. 8. Modeling density and range shifts in striped hamsters based on mechanistic models.
ac The simulation results of striped hamster densities at the three sites under future climate conditions, S1 (a), S2 (b), S3 (c). df Fitted plots showing changes in the distribution range of striped hamsters over a 100-year period under static climate conditions, comparing Flea− and Flea+ scenarios ((d) for S1, (e) for S2, (f) for S3).
Fig. 9
Fig. 9. Modeling range shifts in striped hamsters based on mechanistic models under dynamic climate conditions.
a, b Fitted plots showing the changes in the distribution range of striped hamsters over a 100-year period under dynamic climate conditions for S1 sites, comparing Flea− (a) and Flea+ (b) scenarios. c, d Fitted plots showing the changes in the distribution range of striped hamsters over a 100-year period under dynamic climate conditions for S2 sites, comparing Flea− (c) and Flea+ (d) scenarios. e, f Fitted plots showing the changes in the distribution range of striped hamsters over a 100-year period under dynamic climate conditions for S2 sites, comparing Flea− (e) and Flea+ (f) scenarios.

Similar articles

References

    1. Altizer, S., Bartel, R. & Han, B. A. Animal migration and infectious disease risk. Science331, 296–302 (2011). - PubMed
    1. Poulin, R. & de Angeli, D. D. Animal migrations and parasitism: reciprocal effects within a unified framework. Biol. Rev. Camb. Philos. Soc.96, 1331–1348 (2021). - PubMed
    1. Bartel, R. A., Oberhauser, K. S., De Roode, J. C. & Altizer, S. M. Monarch butterfly migration and parasite transmission in eastern North America. Ecology92, 342–351 (2011). - PMC - PubMed
    1. Balling, T. E. & Pfeiffer, W. Location‐dependent infection of fish parasites in Lake Constance. J. Fish. Biol.51, 1025–1032 (1997).
    1. Aprahamian, M. W. The effect of the migration of Alosa fallax fallax (Laécpède) into fresh water, on branchial and gut parasites. J. Fish. Biol.27, 521–532 (1985).

LinkOut - more resources