. 2025 May 9;16(1):4325.
doi: 10.1038/s41467-025-59235-x.

Large-scale discovery of potent, compact and erythroid specific enhancers for gene therapy vectors

Affiliations

Large-scale discovery of potent, compact and erythroid specific enhancers for gene therapy vectors

Nikoletta Psatha et al. Nat Commun. .

Abstract

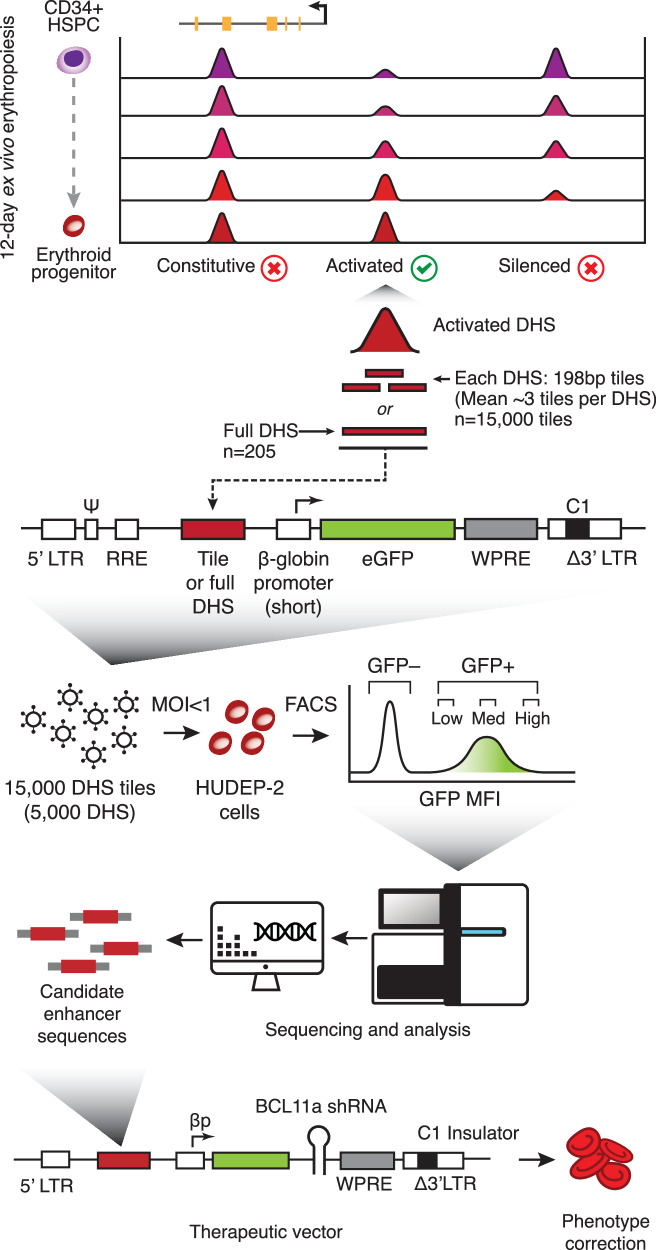
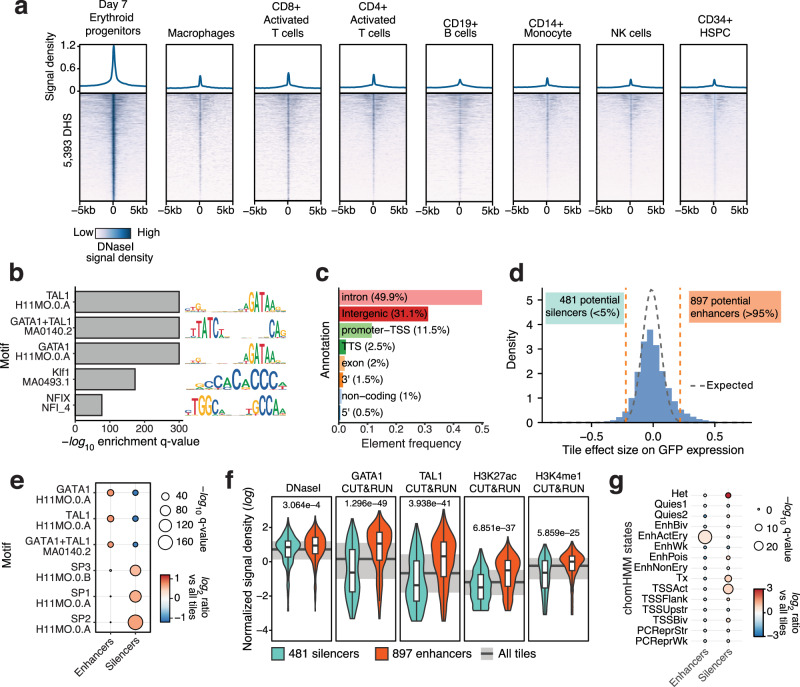
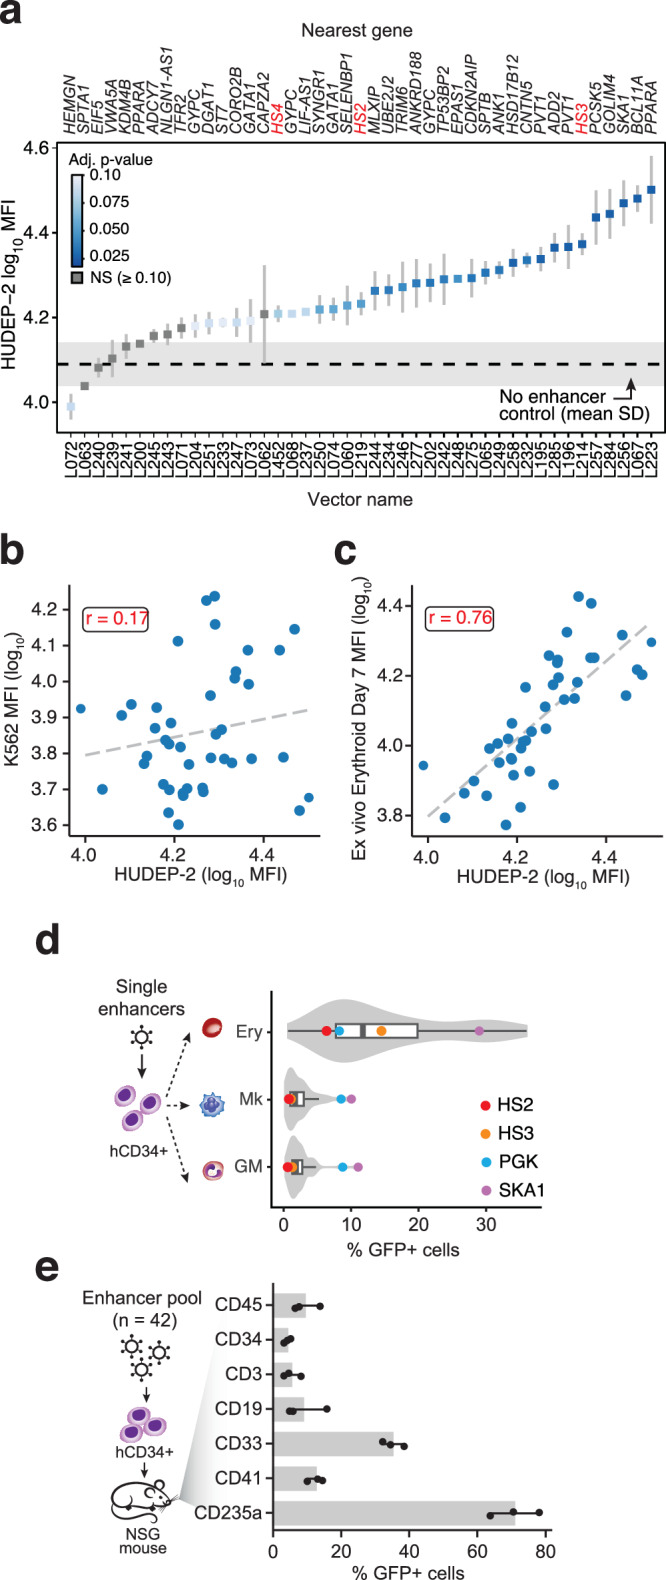
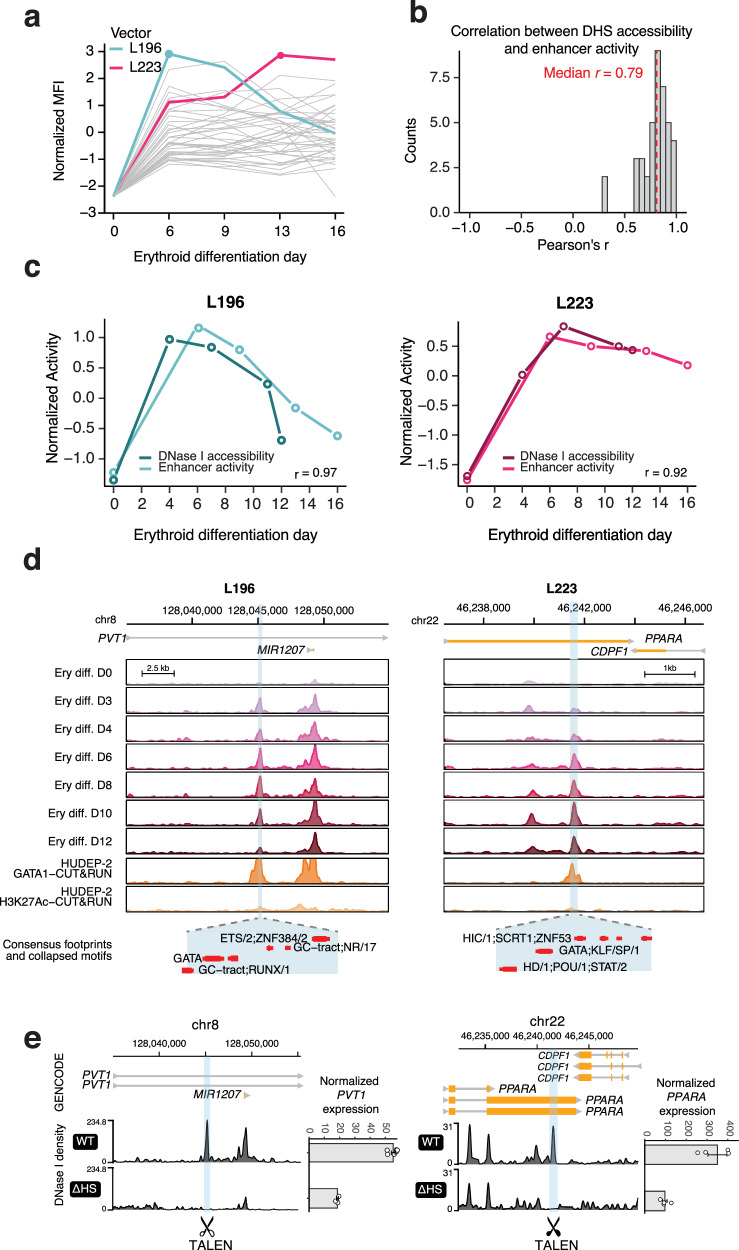
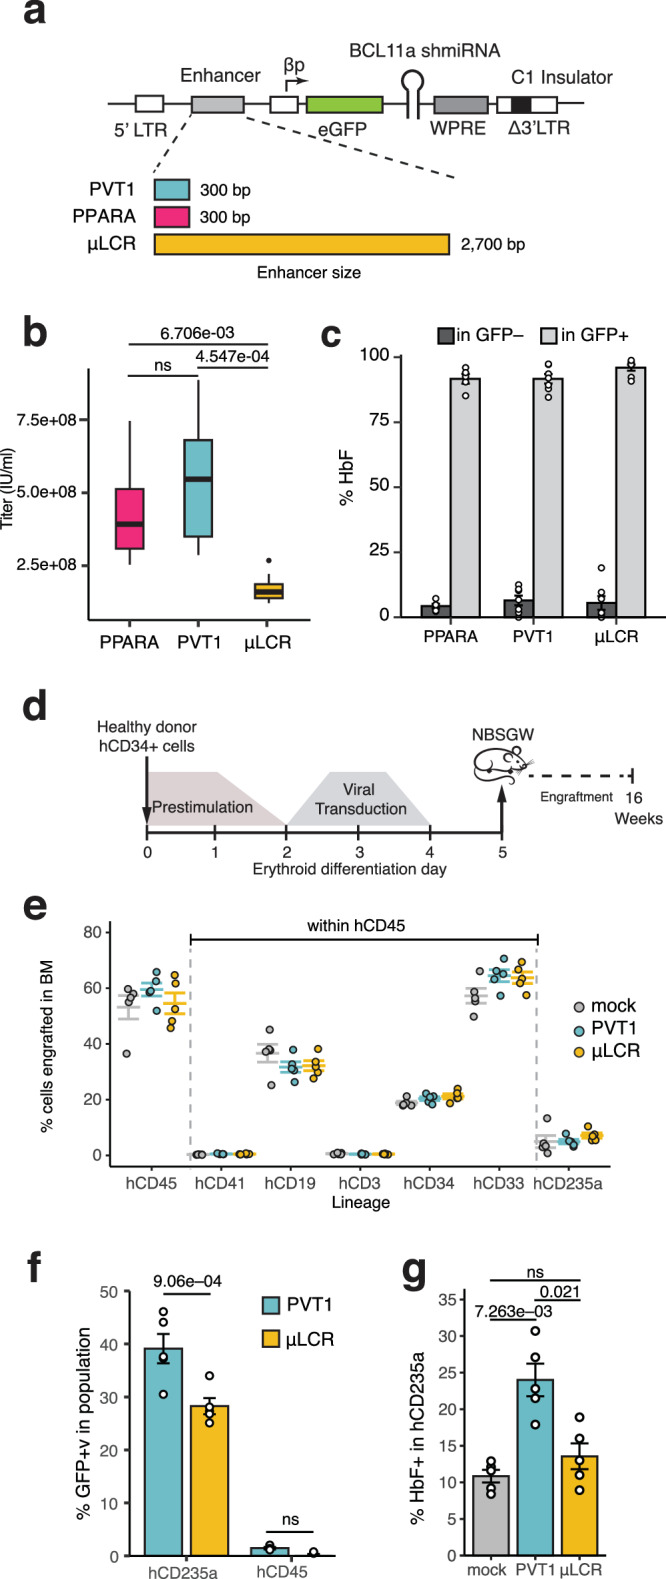
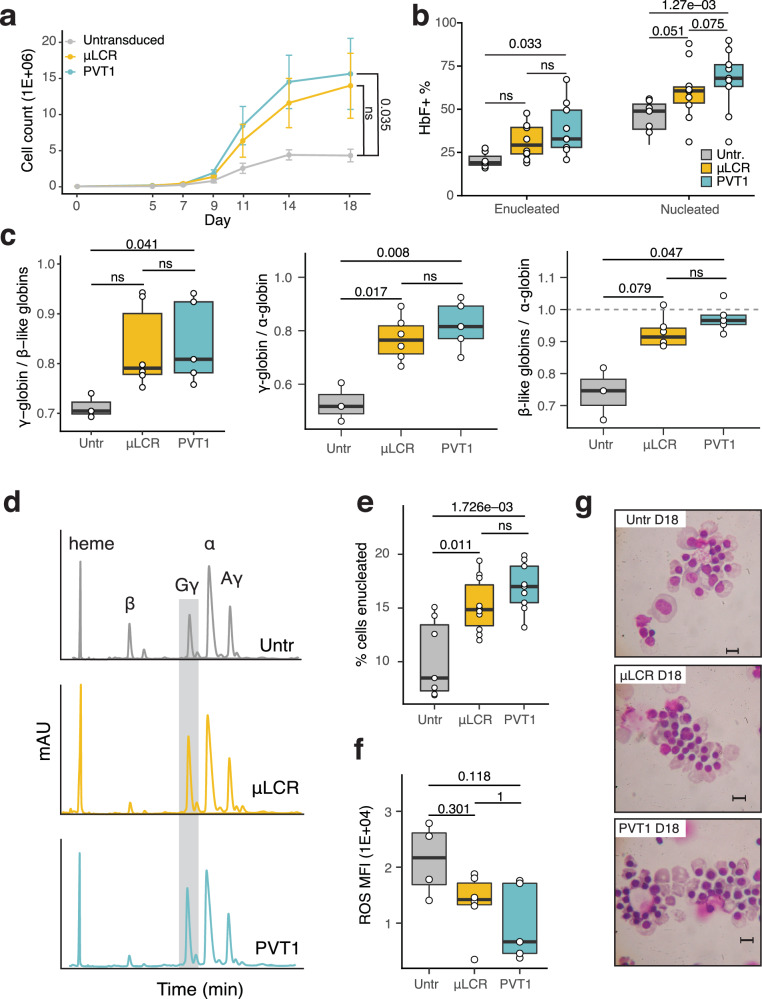
Gene expression during cell development and differentiation is orchestrated by distal regulatory elements that precisely modulate cell selective gene activity. Gene therapy vectors leverage these elements for precise spatiotemporal transgene expression. Here, we develop a one-shot approach to screen candidate regulatory sequences from large-scale epigenomics data for programmable transgene expression within gene therapy viral vectors. We assess a library of 15,000 short sequences derived from developmentally active elements during erythropoiesis using a clinically relevant reporter vector. These elements display a gradient of transcriptional enhancer activity in erythroid cells, with high cell type restriction and developmental stage specificity. Finally, replacing the canonical β-globin μLCR with a compact enhancer in a β-thalassemia lentiviral vector successfully corrects the thalassemic phenotype in patient-derived hematopoietic and stem and progenitor cells (HSPCs), while increasing viral titers and cell transducibility. Our approach provides further insights into enhancer biology with wider implications for human gene therapy.


Conflict of interest statement

Competing interests: N.P., G.G., J.S. and J.V. have filed a patent application (US PPA No. 63224537 and PCT No. US202114752) covering various aspects of this work. The remaining authors declare no competing interests.

Figures

Fig. 1
Fig. 1. An enhancer discovery pipeline for gene therapy applications.
A one-shot approach for screening and functionally validating erythroid specific enhancers for lineage-specific induction of transgene expression at therapeutic levels in gene therapy viral vectors. Briefly, 5393 DNase I hypersensitive sites (DHS) activated de novo during ex vivo human erythropoiesis were selected and broken down into ~3 198bp-long tiles each, comprising a library of total ~15 k elements. The tiles were then cloned into a clinically relevant GFP reporter lentiviral vector and HUDEP-2 cells were transduced at MOI (Multiplicity of infection) <1. The cells were then sorted by flow cytometry into 3 bins based on GFP expression. DNA libraries were constructed from each bin and read counts were assigned to each tile as function of GFP expression. Top performing tiles were then mapped to their full-size DHSs which were then in turn cloned into a therapeutic vector where the candidate elements were assessed based on their ability to achieve phenotypic correction of β-thalassemia patient donor derived erythroid cells. MFI: Mean Fluorescence Intensity.
Fig. 2
Fig. 2. Massively parallel screening and selection of candidate enhancer elements.
a Normalized DNase I density over the 5393 DHS selected ( ± 5 kb from DHS center) across 8 human hematopoietic populations (b) Top 5 enriched motifs within the 5393 selected DHS, ranked by hypergeometric test q-value. c Frequency barchart of the genic features overlapped by the 5393 selected DHS (d) Histogram depicting the distribution of the maximum likelihood estimated effect of each tile on GPF expression. Gray dashed line represents the expected robust fitted gaussian (normal) distribution. Orange dashed lines annotate the 5 and 95 percentiles of the expected distribution. e Top enriched transcription factor binding site motifs within the potential enhancer and silencer tiles. Point size encodes the hypergeometric test q-value (-log10) and the color encodes the log2 ratio over all tiles. f Violins and boxplots depicting the distribution of chromatin accessibility by DNase I, and CUT&RUN density for GATA1, TAL1 as well as H3K27ac and H3K9me3 chromatin marks as measured in HUDEP-2 cells between potential enhancers (n = 897) and potential silencer (n = 481) tiles. Median is shown as a thick horizontal line, boxes extend to IQR (25th and 75th percentile) and whiskers extend to 1.5x IQR. Background thick gray line and gray band show median and IQR (25th and 75th percentile), respectively, of all tiles (n = 14,999). Benjamini-Hochberg corrected Wilcoxon rank sum test p-values are reported. g Enrichment of chromHMM overlapped by potential and enhancer and silencer tiles against the entire tile library. Point size encodes the binomial test q-value (-log10) and the color encodes the log2 ratio over all tiles.
Fig. 3
Fig. 3. Candidate enhancer elements display erythroid-specific activity in vivo and in vitro.
a GFP expression (log10 MFI) of the 40 DHSs individually cloned in the same backbone vector and transduced in HUDEP2 cells at a MOI < 1. Full length β-globin HS2, HS3 and HS4 were used as positive controls and a no-enhancer vector (gray band) as negative control. Mean ± SD is shown. Points are colored by T-test Benjamini-Hochberg adjusted p-value. Transductions were performed in three independent experiments and time points. b Correlation between the GFP intensity (log10 MFI) of the 40 selected elements after transduction in HUDEP-2 cells (x-axis) and in the K562 cell line (y-axis). Beta-globin HS2 and HS3 are annotated. Pearson’s r correlation coefficient is shown (c) Correlation between the GFP intensity (log10 MFI) of the 40 selected elements after transduction in HUDEP-2 cells (x-axis) and in CD34+ differentiated erythroid cells (y-axis). Pearson’s r correlation coefficient is shown. d Each of the 40 identified enhancers is individually transduced into CD34+ cells and each pool (n = 42) is subjected to ex vivo erythroid (Ery), megakaryocytic (Mk) and granulocytic-monocytic (GM) differentiation. After 7 days of differentiation the percentage of GFP+ cells are determined by flow cytometry. Median is shown as a thick horizontal line, boxes extend to IQR and whiskers extend to 1.5x IQR. e Mobilized peripheral blood CD34+ cells from healthy donors were transduced with a lentiviral library of the identified 40 vectors. The cells were transplanted into NBSGW mice and bone marrow was collected 16 weeks post transplantation. Percent of GFP+ cells was assessed by flow cytometry in all engrafted human hematopoietic lineages. Bars extend to mean of n = 3 ± SEM. MFI: Mean Fluorescence Intensity. Ery: Erythroid. Mk: Megakaryocytes. GM: Granulocyte-Monocyte. Source data for all relevant panels are provided within the Source Data file.
Fig. 4
Fig. 4. Candidate enhancer elements are native transcriptional enhancers with erythroid temporal activity.
a Enhancer activity kinetics of the 42 elements as measured by GFP expression with flow cytometry during ex vivo erythroid differentiation from mobilized adult human CD34+ cells. Y-axis depicts MFI z-score across all elements within each time point measured. An early active (L196, teal) and a late active (L223, magenta) element were selected for further study. b Correlation (Pearson’s r) between the temporal profiles of enhancer activity (MFI) of the 42 elements and their in situ DNase I accessibility profile during ex vivo erythropoiesis. Median Pearson’s r is denoted with a dashed red line. c Comparison between the enhancer activity (MFI, light color) and in situ DNase I accessibility (dark color) for the L196 vector (left) and L223 (right). d The enhancer element in the L196 vector is derived from a DHS intronic to the PVT1 lncRNA and the element in L223 is an exonic DHS in the PPARA locus. Signal density tracks of the DNase I accessibility during erythroid differentiation, GATA1 CUT&RUN occupancy and H3K27Ac CUT&RUN enrichment in HUDEP-2 cells is shown for the PVT1 locus (left) and PPARA locus (right). Bottom track shows consensus footprinted motifs overlapping with each element. e Genetic deletion experiments of PVT1 DHS and PPARA DHS in HUDEP-2 cells result in significant repression of PVT1 and PPARA expression, respectively. Browser tracks of the DNase I accessibility in WT HUDEP-2 and mutant (ΔHS) are shown. Barplots show the mean ± SE of normalized gene counts from n = 4 experiments. Source data for all relevant panels are provided within the Source Data file.
Fig. 5
Fig. 5. shmiRNA vectors equipped with compact, potent, erythroid-specific enhancers outperform μLCR-vectors in vitro and in vivo.
a Schematic representation of the vector design showing the difference in size of the new enhancers compared to the μLCR. C1: chromatin insulator, βp: minimal β-globin promoter. b Titration of the PPARA, PVT1 and μLCR BCL11A-shmiRNA vectors in K562 cells based on qPCR. Bonferroni corrected Welch t-test values are shown. n = 10 virus productions in all groups. Median is shown as a thick horizontal line, boxes extend to IQR (25th and 75th percentile) and whiskers extend to 1.5x IQR. c HbF expression (%, mean ± SEM) within the GFP- and GFP+ populations assayed by flow cytometry in transduced HUDEP-2 cells with one of the PPARA (n = 5), PVT1 (n = 7), and μLCR (n = 7) BCL11A-shmiRNA vectors. Transductions in HUDEP-2 cells were performed in independent experiments. d Workflow of the in vivo experiments. Mobilized peripheral blood CD34+ cells from healthy donors were transduced at the same MOI with the μLCR and PVT1-shmiRNA. Mock-transduced cells from the same donor were used as control. Two days post transduction an equal number of cells was transplanted in NBSGW mice. Mice were sacrificed 16 weeks post transplantation. e Human chimerism in the bone marrow (BM) of the transplanted mice. hCD33, hCD19, hCD3, hCD34, hCD41 subpopulations were calculated within the hCD45 population (as % cells, mean ± SEM shown). f GFP expression (as %GFP+ cells, mean ± SEM shown) by flow cytometry in erythroid (hCD235a+) and non-erythroid (hCD45+) engrafted cells. Tukey HSD post-hoc test adjusted p-values are shown. g In vivo HbF expression (as % HbF+ cells, mean ± SEM) identified by flow cytometry in engrafted human erythroid (hCD235a+) cells at the time of sacrifice. In all in vivo experiments shown n = 5 mice per experimental group were used. Bonferroni corrected Welch t-test p-values shown. Non-significant (ns) ≥ 0.1. Source data for all relevant panels are provided within the Source Data file.
Fig. 6
Fig. 6. Therapeutic vectors equipped with PVT1 enhancer achieve superior correction of the β-thalassemia phenotype compared to μLCR.
Mobilized peripheral blood CD34+ cells from 5 patients with beta-thalassemia major were transduced with the PVT1 and μLCR-shmiRNA vectors in the presence of cytokines and small molecules. The cells were cultured under erythroid conditions for 18 days, 2 days post transduction. a Absolute cell numbers (mean ± SEM; n = 5) during erythroid differentiation of transduced and untransduced cells. Bonferroni corrected Wilcoxon rank sum test p-values are shown. b HbF expression (as %HbF+ cells) measured by flow cytometry in enucleated and nucleated cells on day 18 of ex vivo erythroid differentiation. Tukey HSD post-hoc test adjusted p-values shown. c Globin chain production displayed as γ to β-like, γ to α, and β-like to α ratio in transduced and untransduced cells measured by HPLC. Tukey adjusted post-hoc test with Welch correction p-values shown. d HPLC trace profiles of globin chains in transduced and untransduced β0/β+ patient CD34+ derived erythroid cells. e Percentage of enucleated cells on day 18 of the differentiation measured by flow cytometry. Bonferroni corrected Welch t-test p-values are shown. f Flow cytometry measured intensity of reactive oxygen species (ROS) post CFSE staining of erythroid cells on day 11 of the erythroid culture. Post-hoc Tukey HSD test adjusted p-values shown. g Characteristic morphology of transduced and untransduced erythroid cells in different erythroid differentiation and maturation stages. Non-significant (ns) ≥0.1. Boxplots extend to IQR (25th and 75th percentile). Median is shown as a thick horizontal line and whiskers extend to 1.5x IQR. Untr.: Untransduced control. Source data for all relevant panels are provided within the Source Data file.

Similar articles

Cited by

References

    1. Locatelli, F. et al. Betibeglogene autotemcel gene therapy for non–β0/β0 genotype β-thalassemia. N. Engl. J. Med.386, 415–427 (2021). - PubMed
    1. Fumagalli, F. et al. Lentiviral haematopoietic stem-cell gene therapy for early-onset metachromatic leukodystrophy: long-term results from a non-randomised, open-label, phase 1/2 trial and expanded access. Lancet399, 372–383 (2022). - PMC - PubMed
    1. Florian, E. et al. Hematopoietic stem-cell gene therapy for cerebral adrenoleukodystrophy. N. Engl. J. Med.377, 1630–1638 (2017). - PMC - PubMed
    1. Kwiatkowski, J. L. et al. Betibeglogene autotemcel gene therapy in patients with transfusion-dependent, severe genotype β-thalassaemia (HGB-212): a non-randomised, multicentre, single-arm, open-label, single-dose, phase 3 trial. Lancet404, 2175–2186 (2024). - PubMed
    1. Consortium, T. E. P. An integrated encyclopedia of DNA elements in the human genome. Nature489, 57–74 (2011). - PMC - PubMed

LinkOut - more resources