. 2025 May 9;10(1):91.
doi: 10.1038/s41541-025-01143-8.

Global socioeconomic inequalities in vaccination coverage, supply, and confidence

Affiliations

Global socioeconomic inequalities in vaccination coverage, supply, and confidence

Qiang Wang et al. NPJ Vaccines. .

Abstract

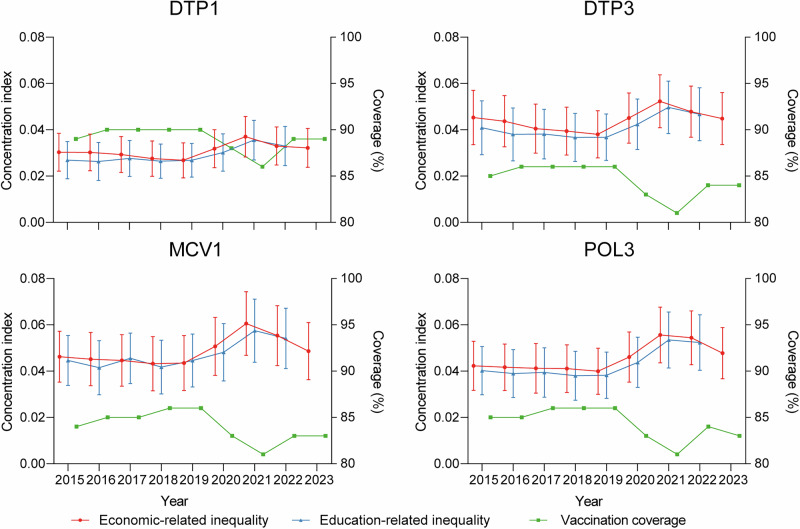
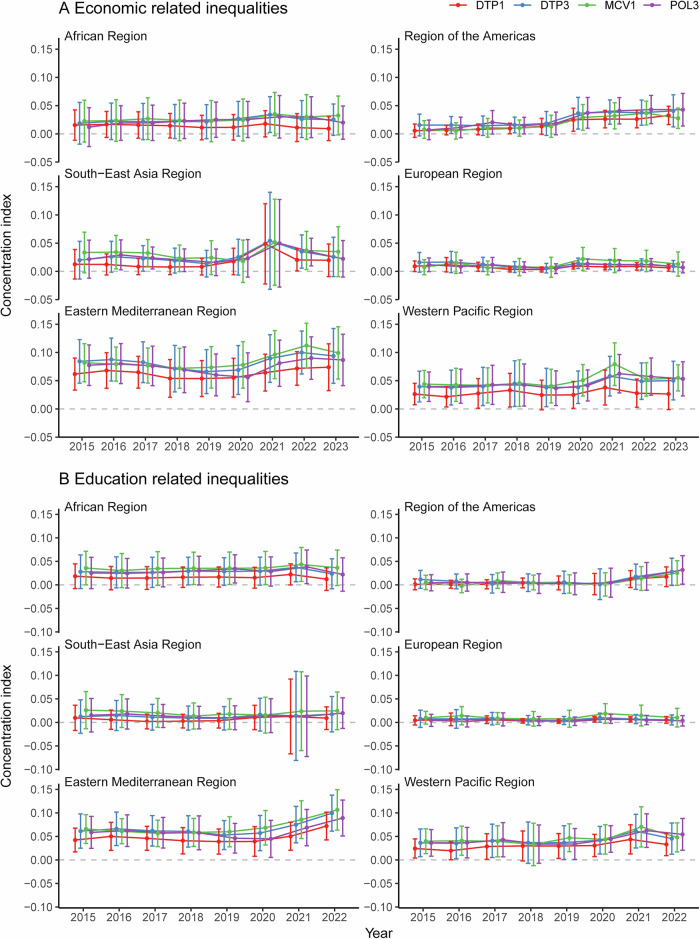
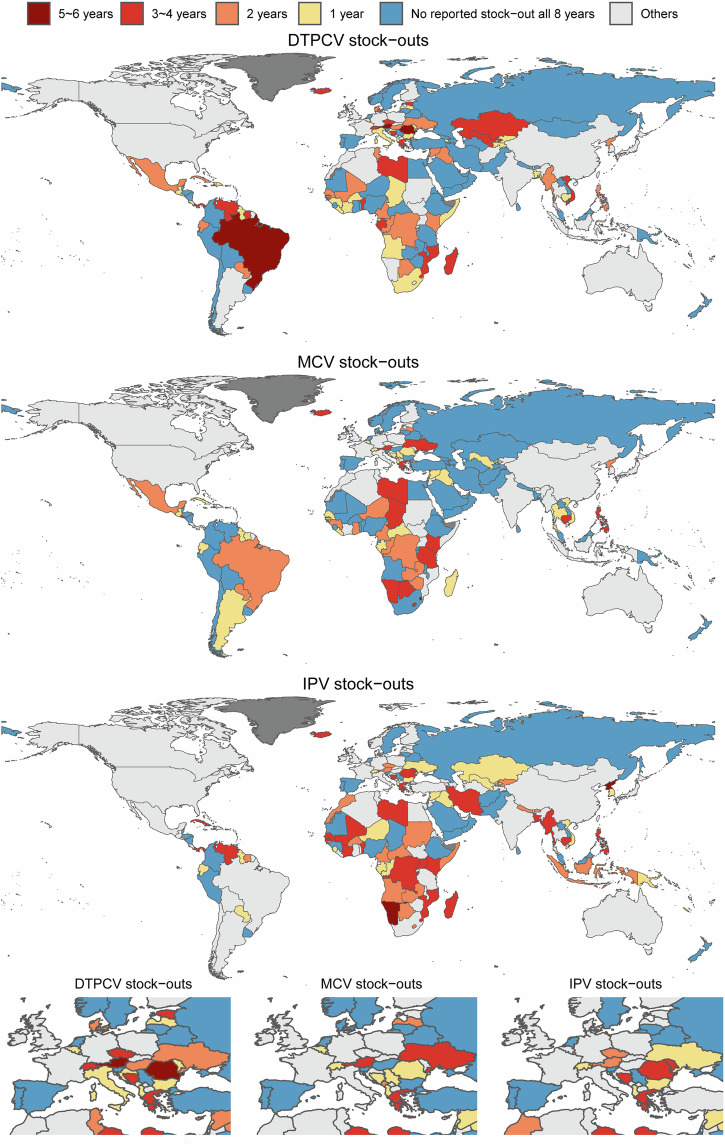
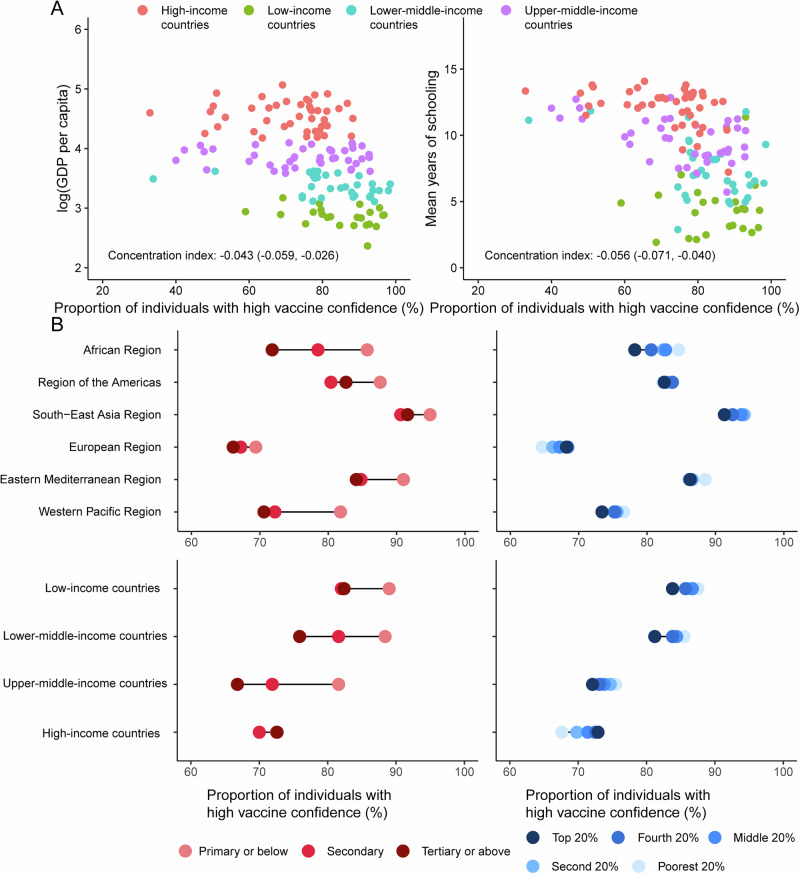
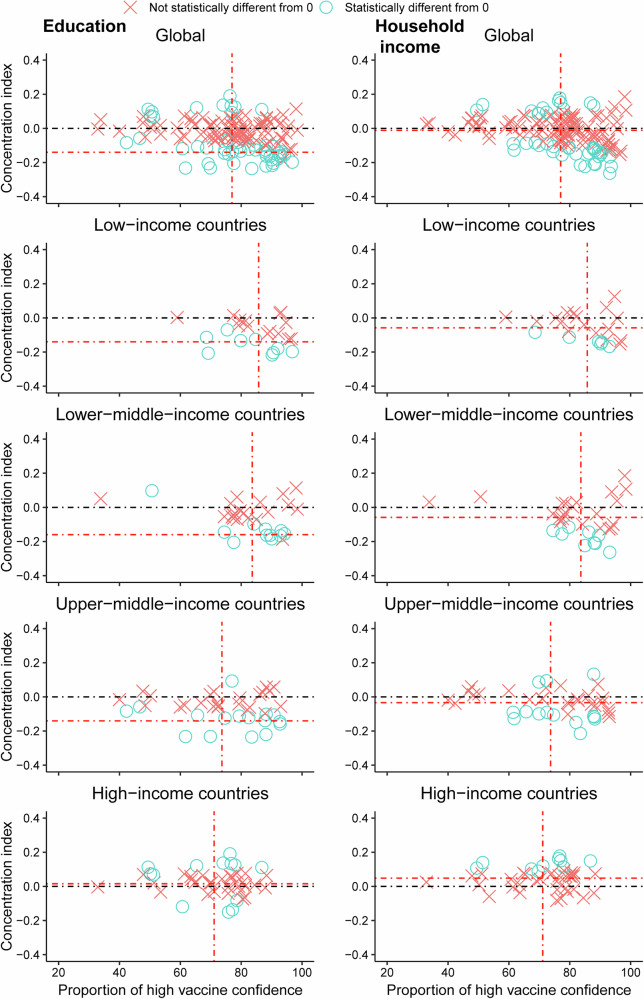
Sustainable Development Goal (SDG) adopted in 2015 aim to reduce inequalities and achieve universal health coverage, including access to essential vaccines for all. Using data from WHO, the Vaccine Confidence Project™, World Bank, and UNDP, we analyzed between-country inequalities in coverage of four vaccines (DTP1, DTP3, MCV1, and POL3), vaccine stock-outs, and vaccine confidence. Economic- and education-related inequalities in coverage (measured by the concentration index) declined from 2015 to 2019, increased in 2020, peaked in 2021, and have declined again since 2022. Inequalities increased continuously in the Region of the Americas. Over 2015-2022, 94 countries/territories reported at least one national level DTP-containing vaccine stock-out. Countries/territories with higher income or education attainment showed lower vaccine confidence. Our study underscores the decrease of inequalities in vaccination coverage following the SDG adoption in most regions, and emphasizes the need to address vaccine stock-outs and strength the vaccine confidence.


Conflict of interest statement

Competing interests: The authors declare no competing interests.

Figures

Fig. 1
Fig. 1. Global economic- and education-related between-country inequalities in vaccination coverage.
Red lines show the economic-related CI with error bar representing 95% confidential interval. Blue lines show the education-related CI with error bar representing 95% confidential interval. Green lines indicate the vaccination coverage across all WHO member countries/territories. Positive CI values denote higher vaccination coverage among countries with more wealth or higher education. CI concentration index.
Fig. 2
Fig. 2. Regional economic- and education-related between-country inequalities in vaccination coverage.
A the economic-related inequalities in vaccination coverage between countries. B the education-related inequalities in vaccination coverage between countries. Positive CI values denote higher vaccination coverage among countries with more wealth or higher education. The gray dashed line represents the statistically invalid line. The CI with 95% confidential interval crossing the gray line show the inequality was not statistically significant. CI concentration index.
Fig. 3
Fig. 3. The reported frequency of national-level vaccine stock-outs from 2015 to 2022.
The figure illustrates the occurrence of DTPCV, MCV, and IPV stock-outs at the national level between 2015 and 2022. Categories are defined as follows: “5–6 years” indicates that the country experienced the vaccine stock-outs for 5 or 6 of the 8 years; “3–4 years” denotes stock-outs for 3 or 4 years; “2 year” denotes stock-outs in 2 years; “1 year” denotes stock-outs in a single year. “No reported stock-out all 8 years” indicates that the country did not report any stock-outs during this period. Three horizontally aligned subplots at the bottom are included to illustrate stock-outs in Europe. Base map data from Natural Earth (public domain), rendered using R packages rnaturalearth, rnaturalearthdata, and sf.
Fig. 4
Fig. 4. Vaccine confidence by education and income.
A Scatter plot shows the proportion of individuals with high vaccine confidence and socioeconomic status at the national level. For presentation purposes, we use log-transformed values of GDP per capita. B Data are proportion of individuals with high vaccine confidence by individuals’ sociodemographic at WHO regions and country-income groups.
Fig. 5
Fig. 5. Economic- and education- related within-country inequalities in vaccine confidence.
Data are within-country inequalities in vaccine confidence compared with national proportion of individuals with high vaccine confidence. Red dashed lines show the global and regional between-country inequalities and proportion of individuals with high vaccine confidence. Black dashed line represents no inequality. Positive CI values denote higher vaccine confidence among richer or more educated individuals, and negative CI values denote higher vaccine confidence among poorer or less educated individuals. A blue circle means that the CI is statistically significant and a red cross means that the CI is not statistically significant. CI concentration index.

Similar articles

References

    1. World Health Organization. Immunization dashboard, accessed 15 January 2023. https://immunizationdata.who.int/.
    1. World Health Organization. Immunization and vaccine-preventable communicable diseases, accessed 10 March 2025. https://www.who.int/data/gho/data/themes/immunization.
    1. United Nations Open working group proposal for Sustainable Development Goals, accessed 7 April 2023. https://sustainabledevelopment.un.org/sdgsproposal.html (2015).
    1. Shet, A. et al. Impact of the SARS-CoV-2 pandemic on routine immunisation services: evidence of disruption and recovery from 170 countries and territories. Lancet Glob. Health10, e186–e194 (2022). - PMC - PubMed
    1. Lai, X. et al. Estimating global and regional between-country inequality in routine childhood vaccine coverage in 195 countries and territories from 2019 to 2021: a longitudinal study. EClinicalMedicine60, 102042 (2023). - PMC - PubMed

LinkOut - more resources