

Photoprotective activity from Colombian Caribbean brown algae using HPLC-DAD metabolic profiling by MCR-ALS data analysis
- PMID: 40346135
- PMCID: PMC12064669
- DOI: 10.1038/s41598-025-00734-8
Photoprotective activity from Colombian Caribbean brown algae using HPLC-DAD metabolic profiling by MCR-ALS data analysis
Abstract
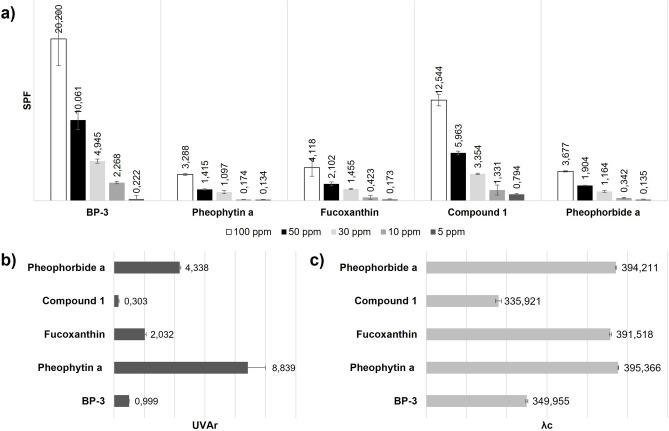
Although synthetic UV filters are widely used for skin photoprotection, growing concerns about their environmental and health impacts underscore the need for new, effective photoprotective products. This study aimed to develop a screening methodology for selecting brown macroalgae extracts with potential photoprotective activity. The approach integrates in vitro photoprotection assays, antioxidant TLC-DPPH assays, and HPLC-DAD metabolic profiling of 17 algal samples from the Dictyota, Canistrocarpus, Stypopodium, Sargassum, Lobophora, Padina, and Turbinaria genera. The results revealed concentration-dependent sun protection factor (SPF) values ranging from 0.403 to 2.915, UVA ratios (UVAr) ranging from 0.167 to 3.623, critical wavelengths (λc) ranging from 335 to 393 nm, and antioxidant DPPH-TLC activity in 10 of the evaluated extracts. These findings were correlated with the HPLC-DAD metabolic profile using the Multivariate Curve Resolution- Alternating Least Squares (MCR-ALS) algorithm and multivariate data analysis tools. Extracts from Canistrocarpus cervicornis (CCe) and Stypopodium zonale (SS) presented the most promising photoprotective activity. Through NMR and MS analysis, 2,5,7-trihydroxy-2-pentadecylchroman-4-one (1), fucoxanthin, pheophytin a, and pheophorbide a were identified as the main contributors to this activity. This methodology was successfully implemented and could be further used to screen for photoprotective activity in algal species.
Keywords: MCR-ALS; Metabolic profiling; Ochrophyta; Photoprotection; Radiation; Screening.
© 2025. The Author(s).
Conflict of interest statement
Declarations. Competing interests: The authors declare no competing interests.
Figures
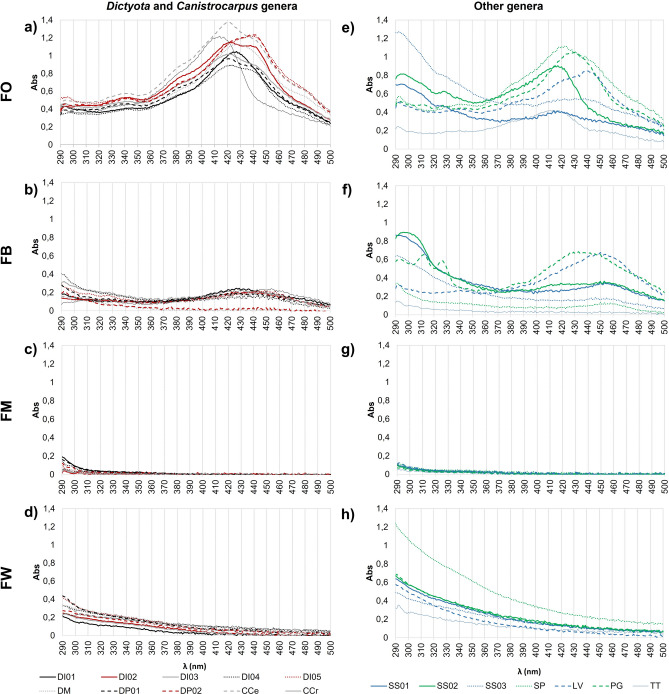
 DI01,
DI01,  DI02,
DI02,  DI03,
DI03,  DI04,
DI04,  DI05,
DI05,  DM,
DM,  DP01, and
  DP02) and Canistrocarpus (
 CCe and
  CCr) genera: (a) FO extracts, (b) FB extracts, (c) FM extracts, and (d) FW extracts. (e–h) spectra of extracts from Stypopodium (
 SS01,
SS01,  SS02, and
  SS03), Saragassum (
 SP), Lobophora (
 LV), Padina (
 PG), and Turbinaria (
 TT) genera: (e) FO extracts, (f) FB extracts, (g) FM extracts, and (h) FW extracts.
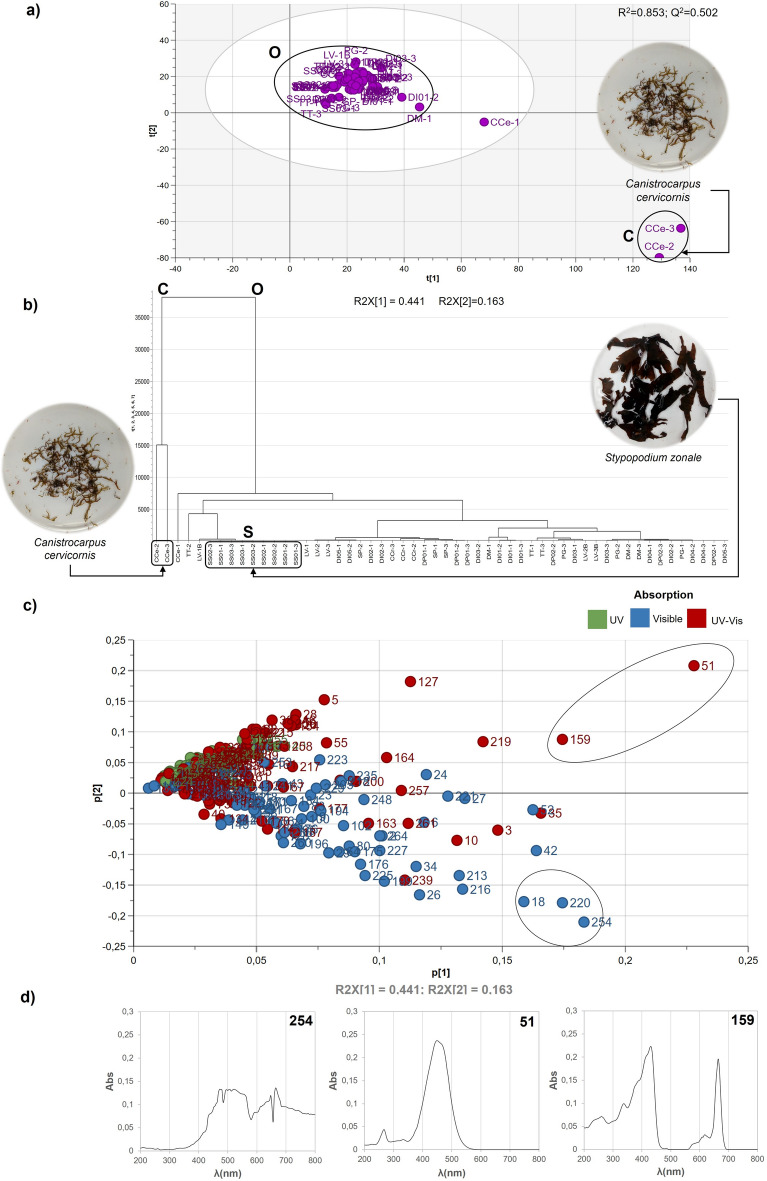
 ) (UV absorption; λ = 290–400 nm); (
 ) (visible absorption; λ = 400–800 nm); (
 ) (UV–Vis absorption; λ = 290–800). The black circumferences represent sample clusters and important variables for extract differentiation.
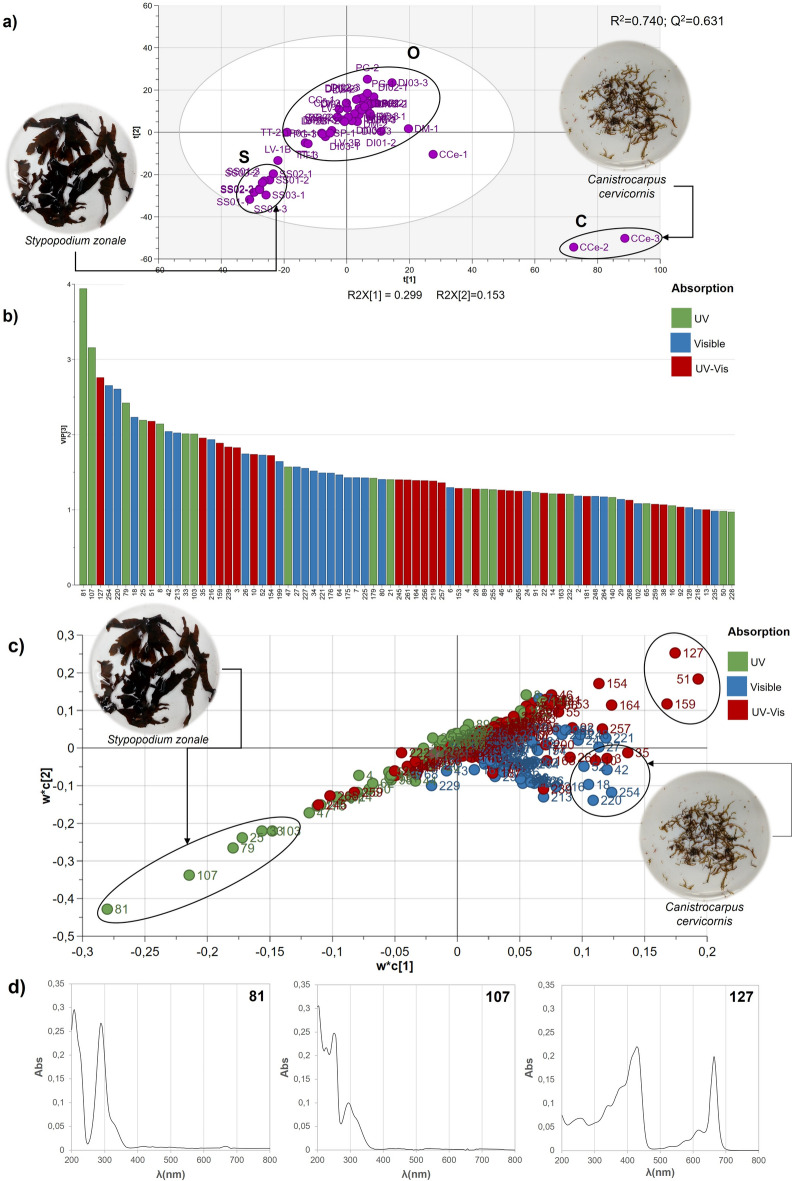
 ) (UV absorption; λ = 290–400 nm); (
 ) (visible absorption; λ = 400 -800 nm); and (
 ) (UV–VIS absorption; λ = 290–800). The black circumferences represent sample clusters and important variables for extract differentiation.* UVAr values correspond to the mean of three replicates at different concentrations, as no significant differences were observed between extracts at the evaluated concentrations.
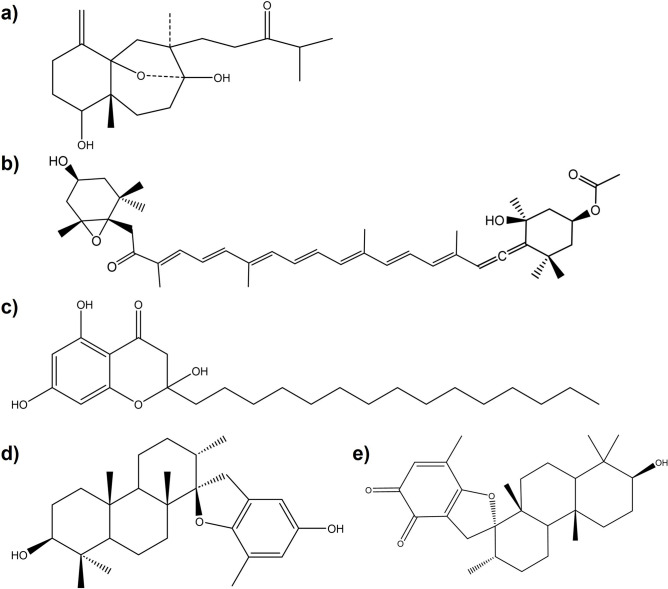
Similar articles
-
Selected Extracts from High Mountain Plants as Potential Sunscreens with Antioxidant Capacity.Photochem Photobiol. 2022 Jan;98(1):211-219. doi: 10.1111/php.13490. Epub 2021 Jul 30. Photochem Photobiol. 2022. PMID: 34289116
-
Novel UV filters from Pentacalia pulchella extracts with photoprotective properties and antioxidant activity.Photochem Photobiol Sci. 2021 Dec;20(12):1585-1597. doi: 10.1007/s43630-021-00120-z. Epub 2021 Nov 1. Photochem Photobiol Sci. 2021. PMID: 34724169
-
Photoprotection and antioxidant activity of eumelanin from Streptomyces lasalocidi NTB 42 and its photoprotective effects on Schizosaccharomyces pombe ARC039.J Photochem Photobiol B. 2025 Jan;262:113085. doi: 10.1016/j.jphotobiol.2024.113085. Epub 2024 Dec 22. J Photochem Photobiol B. 2025. PMID: 39724842
-
The use of natural extracts with photoprotective activity: a 2015-2023 patent prospection.Photochem Photobiol Sci. 2024 May;23(5):853-869. doi: 10.1007/s43630-024-00559-w. Epub 2024 Apr 13. Photochem Photobiol Sci. 2024. PMID: 38613600 Review.
-
Natural products and extracts from plants as natural UV filters for sunscreens: A review.Animal Model Exp Med. 2023 Jun;6(3):183-195. doi: 10.1002/ame2.12295. Epub 2022 Dec 19. Animal Model Exp Med. 2023. PMID: 36536536 Free PMC article. Review.
References
-
- Barnes, P. W. et al. Ozone depletion, ultraviolet radiation, climate change and prospects for a sustainable future. Nat. Sustain.2, 569–579 (2019).
-
- Nadim, S. Sunscreen evolution. In Sunscreens: Regulations and commercial development 3–16 (Taylor& Francis Group, 2005).
-
- Saewan, N. & Jimtaisong, A. Natural products as photoprotection. J. Cosmet. Dermatol.14, 47–63 (2015). - PubMed
-
- Grupo de estudios Económicos (Superintendencia de Industria y Comercio). Estudios Económicos Sectoriales: Protectores Solares en Colombia (2015–2019). 0–37 (2020).
-
- Sklar, L. R., Almutawa, F., Lim, H. W. & Hamzavi, I. Effects of ultraviolet radiation, visible light, and infrared radiation on erythema and pigmentation: A review. Photochem. Photobiol. Sci.12, 54–64 (2013). - PubMed
MeSH terms
Substances
Grants and funding
- 1101-852-69964/Ministerio de Ciencia, Tecnología e Innovación
- 1101-852-69964/Ministerio de Ciencia, Tecnología e Innovación
- 1101-852-69964/Ministerio de Ciencia, Tecnología e Innovación
- 1101-852-69964/Ministerio de Ciencia, Tecnología e Innovación
- 1101-852-69964/Ministerio de Ciencia, Tecnología e Innovación
LinkOut - more resources
Full Text Sources
Medical
Miscellaneous
