

Examining measurement discrepancies in adolescent screen media activity with insights from the ABCD study
- PMID: 40346141
- PMCID: PMC12064680
- DOI: 10.1038/s44184-025-00131-z
Examining measurement discrepancies in adolescent screen media activity with insights from the ABCD study
Abstract
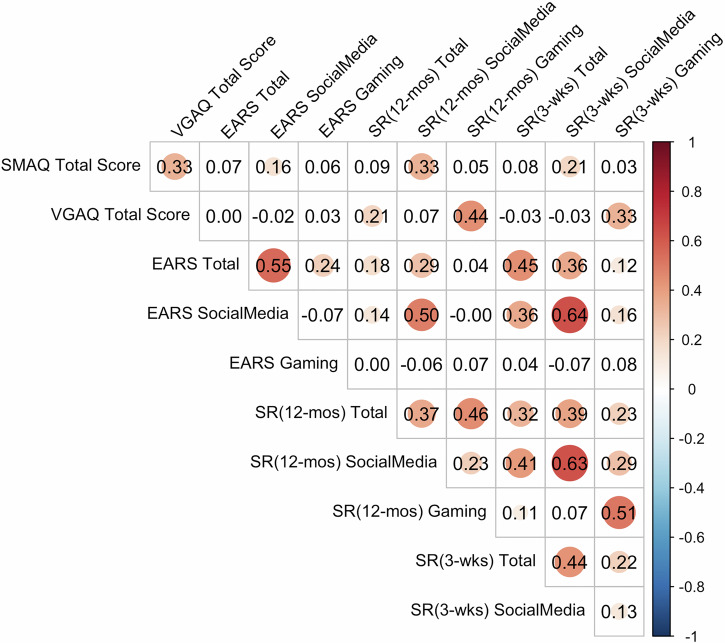
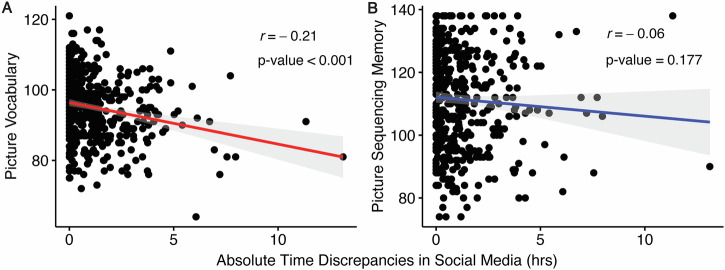
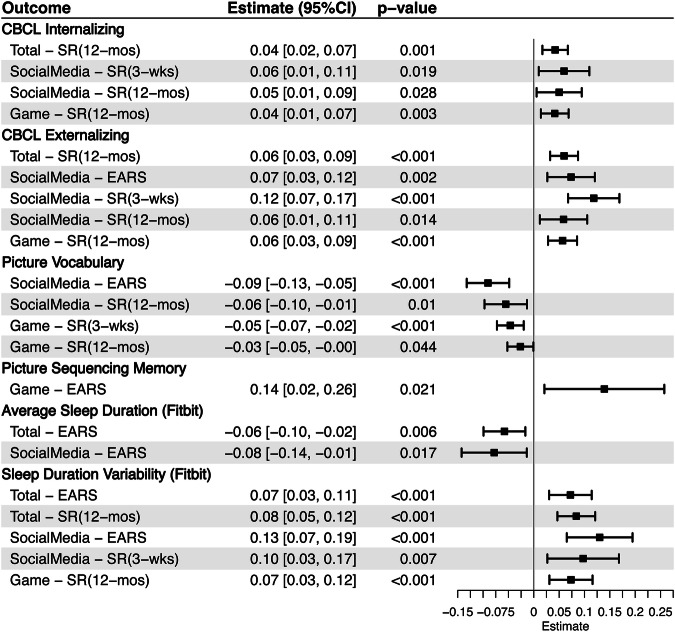
Concerns about the accuracy of self-reported screen time persist due to discrepancies with objective measures. This study compared passive smartphone tracking via the "Effortless Assessment of Risk States'' (EARS) app with self-reported screen time from 495 adolescents. Based on self-reports, 94.26% of social media use occurred on smartphones. EARS-recorded social media use was higher (1.64 ± 1.93 h) than past-year self-report (1.44 ± 1.97 h; p = 0.037) but similar to post-sensing self-report (1.63 ± 1.93 h; p = 0.835). Higher picture vocabulary scores were associated with lower odds of under-reporting social media use (OR = 0.96, 95% CI: 0.93-0.99). Both self-reported (β = 0.06, 95% CI: 0.01-0.11) and EARS (β = 0.07, 95% CI: 0.03-0.12) measures correlated with externalizing symptoms. They were also correlated with social media addiction (self-reported:β = 0.15, 95% CI: 0.10-0.20; EARS:β = 0.06, 95% CI: 0.01-0.11). However, past-year self-report uniquely correlated with internalizing symptoms (β = 0.05, 95% CI: 0.01-0.09) and video game addiction (β = 0.05, 95% CI: 0.01-0.10). These findings highlight the value of integrating self-report and objective measures in screen media use research.
© 2025. The Author(s).
Conflict of interest statement
Competing interests: Dr. Potenza has consulted for Opiant Therapeutics, Game Day Data, the Addiction Policy Forum, AXA and Idorsia Pharmaceuticals; has been involved in a patent application with Yale University and Novartis; has received research support from Mohegan Sun Casino and the National Center for Responsible Gaming; has participated in surveys, mailings or telephone consultations related to drug addiction, impulse-control disorders or other health topics; has consulted for and/or advised gambling and legal entities on issues related to impulse-control/addictive disorders; has provided clinical care in a problem gambling services program; has performed grant reviews for research-funding agencies; has edited journals and journal sections; has given academic lectures in grand rounds, CME events and other clinical or scientific venues; and has generated books or book chapters for publishers of mental health texts. The other authors do not report disclosures.
Figures
Similar articles
-
Passively sensing smartphone use in teens with rates of use by sex and across operating systems.Sci Rep. 2024 Aug 3;14(1):17982. doi: 10.1038/s41598-024-68467-8. Sci Rep. 2024. PMID: 39097657 Free PMC article.
-
Passive Sensing of Preteens' Smartphone Use: An Adolescent Brain Cognitive Development (ABCD) Cohort Substudy.JMIR Ment Health. 2021 Oct 18;8(10):e29426. doi: 10.2196/29426. JMIR Ment Health. 2021. PMID: 34661541 Free PMC article.
-
Associations Between Time Spent Using Social Media and Internalizing and Externalizing Problems Among US Youth.JAMA Psychiatry. 2019 Dec 1;76(12):1266-1273. doi: 10.1001/jamapsychiatry.2019.2325. JAMA Psychiatry. 2019. PMID: 31509167 Free PMC article.
-
Screen Time and Autism Spectrum Disorder: A Systematic Review and Meta-Analysis.JAMA Netw Open. 2023 Dec 1;6(12):e2346775. doi: 10.1001/jamanetworkopen.2023.46775. JAMA Netw Open. 2023. PMID: 38064216 Free PMC article.
-
A systematic review and meta-analysis of discrepancies between logged and self-reported digital media use.Nat Hum Behav. 2021 Nov;5(11):1535-1547. doi: 10.1038/s41562-021-01117-5. Epub 2021 May 17. Nat Hum Behav. 2021. PMID: 34002052
References
-
- Office of the Surgeon General (OSG). Social Media and Youth Mental Health: The U.S. Surgeon General’s Advisory [Internet]. US Department of Health and Human Services; Washington (DC), (2023). - PubMed
-
- Sanders, T. et al. An umbrella review of the benefits and risks associated with youths’ interactions with electronic screens. Nat. Hum. Behav. 8, 82–89 (2023). - PubMed
-
- Przybylski, A. K. & Weinstein, N. A large-scale test of the goldilocks hypothesis. Psychol. Sci.28, 204–215 (2017). - PubMed
Grants and funding
- P20GM121312/GM/NIGMS NIH HHS/United States
- U01 DA051018/DA/NIDA NIH HHS/United States
- U01 DA041093/DA/NIDA NIH HHS/United States
- U01 DA051037/DA/NIDA NIH HHS/United States
- U01 DA051016/DA/NIDA NIH HHS/United States
- U01 DA041117/DA/NIDA NIH HHS/United States
- U01 DA041148/DA/NIDA NIH HHS/United States
- U01 DA041174/DA/NIDA NIH HHS/United States
- P20 GM121312/GM/NIGMS NIH HHS/United States
- U24 DA041147/DA/NIDA NIH HHS/United States
- R01 AA029611/AA/NIAAA NIH HHS/United States
- U01 DA051039/DA/NIDA NIH HHS/United States
- U01 DA041120/DA/NIDA NIH HHS/United States
- U01DA050989/DA/NIDA NIH HHS/United States
- U24 DA041123/DA/NIDA NIH HHS/United States
- RF1 MH128614/MH/NIMH NIH HHS/United States
- U01 DA051038/DA/NIDA NIH HHS/United States
- RF1MH128614/MH/NIMH NIH HHS/United States
- U01 DA041134/DA/NIDA NIH HHS/United States
- U01 DA041022/DA/NIDA NIH HHS/United States
- U01 DA041156/DA/NIDA NIH HHS/United States
- U01 DA050987/DA/NIDA NIH HHS/United States
- U01 DA041025/DA/NIDA NIH HHS/United States
- U01 DA050989/DA/NIDA NIH HHS/United States
- U01 DA041089/DA/NIDA NIH HHS/United States
- U01 DA050988/DA/NIDA NIH HHS/United States
- R01AA029611/AA/NIAAA NIH HHS/United States
- U01 DA041106/DA/NIDA NIH HHS/United States
- U01 DA041028/DA/NIDA NIH HHS/United States
- U01 DA041048/DA/NIDA NIH HHS/United States
LinkOut - more resources
Full Text Sources
Miscellaneous
