. 2025 May 9;15(1):16260.
doi: 10.1038/s41598-025-00905-7.

Heuristic pruning of decision trees at low probabilities and probability discounting in sequential planning in young and older adults

Affiliations

Heuristic pruning of decision trees at low probabilities and probability discounting in sequential planning in young and older adults

Sophia-Helen Sass et al. Sci Rep. .

Abstract

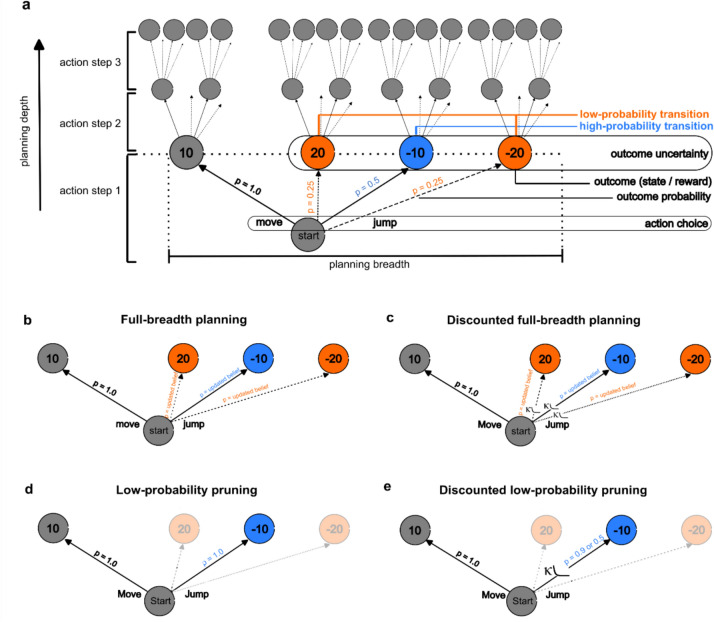
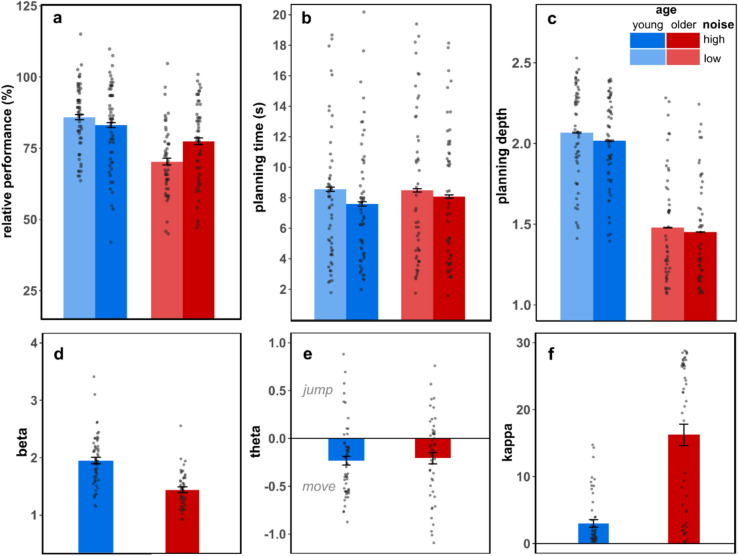
When planning an action sequence, it has been shown that humans prune decision trees to reduce computational complexity, instead of considering all possible options. However, little is understood about pruning employed in probabilistic environments, where actions result in multiple outcomes with varying probabilities, and how decision biases, such as discounting of probabilistic rewards, influence decisions. This study investigates whether participants prune low-probability options in a three-step decision-making task and analyzes the impact of probability discounting on planning. Potential age-related differences in planning strategies are explored in groups of young (aged 18-35 years; n = 57) and older (aged 65-75 years; n = 50) adults. By using reinforcement-learning modeling and model comparison, we show that participants reduce computational demands by pruning decision tree branches of lower probability-a highly efficient strategy in this environment. Additionally, participants reduce their planning depth, i.e., the number of considered steps. Planning is further influenced by discounting high-probability outcomes. Older individuals show stronger reductions in planning depth, an increase in decision noise, and more pronounced probability discounting, which contributes to the observed age-related decline in planning performance. Our findings suggest directions for future research to elucidate the underlying meta-control mechanisms guiding the application of planning strategies.


Conflict of interest statement

Declarations. Competing interests: The authors declare no competing interests.

Figures

Fig. 1
Fig. 1
Schematic of the space adventure task. (a) Example mini-block with three action steps (green squares) and low noise (black background). There are six planets with the yellow rocket on the left planet, indicating the current location. The fuel bar at the top of the screen showed the accumulated amount of fuel points throughout the task. (b) The five planet types with their respective gain or loss of fuel points. (c) Transition matrix of the deterministic move action (white arrows) and the probabilistic jump action (red arrows). The matrix was once presented to participants for memorization and practiced during training. (d) Visualization of outcome uncertainty for the probabilistic jump action to the target planet (solid arrow, high-probability transition) and its neighbors (dashed arrows, low-probability transitions). Asteroids in the background indicate high-noise condition, where transitions probabilities were 50% (high-probability transition) and 25% (respective two low-probability transitions). In the low-noise condition, transition probabilities were 90% (high-probability transition) and 5% (respective two low-probability transitions). Participants were informed about probabilistic transitions and potential outcomes in general but had to infer the probabilities from experience in 10 respective training mini-blocks.
Fig. 2
Fig. 2
Schematic of the decision tree in the SAT and the four alternative planning strategies. (a) The schematic refers to the example mini-block shown in Fig. 1a. Branches following low-probability transitions from action step 2 onwards are not shown for clarity. (be) Each of the four figures refers to the decision tree for one action step in the SAT according to each decision strategy for the four cognitive models. The schematic refers to action step 1 in the example mini-block shown in Fig. 1a and is generalized for both, the low-noise condition (p = 5% low-probability transition) and the high-noise condition (p = 25% low-probability transition). The orange planets indicate the low-probability transitions; the blue planet indicates the high-probability transition according to the transition matrix. (b) Full-breadth planning: All possible outcomes and their learned probabilities are considered during planning. (c) Discounted full-breadth planning: All possible outcomes and their learned probabilities are considered during planning. Probabilistic outcomes are discounted with a participant-specific discounting factor (κ) based on their learned probabilities. (d) Low-probability pruning: Low-probability outcomes are pruned. Only high-probability outcomes are considered during planning. All transitions are treated as deterministic. (e) Discounted low-probability pruning: Low-probability outcomes are pruned. Only high-probability outcomes are considered during planning. They are discounted with a participant-specific discounting factor (κ) based on their real transition probabilities.
Fig. 3
Fig. 3
Comparison of points earned in the SAT across 120 mini-blocks for various strategies (simulated data). The relative performance was scaled between optimal performance (full-breadth planning strategy, planning depth three) and random performance as null reference. The relative performance for each strategy is informed by the sum of the average gain of points per mini-block of 1000 agents. The discounting factor for the respective models was set on formula image = 3 (8).
Fig. 4
Fig. 4
Model comparison. Model fit mean across group and condition. Error bars indicate standard error of the mean. (a) Pseudo Rho-squared ρ2 (standardized measure of model fit, uncorrected), higher values indicate a better model fit. (b) Bayesian Information Criterion (formula image), lower values indicate a better model fit. (c) Evaluation of all six possible pair-wise comparisons of model evidence using formula image. Absolute (rounded) values are reported for better interpretability. Model evidence interpretation is based on Neath & Cavanaugh with “bare mention” for formula image, “positive” for formula image, and “strong” for formula image.
Fig. 5
Fig. 5
Group and condition means of behavioral measures and inferred model parameters. (a) Relative performance as absolute gain of points scaled between the mean gain of points of an optimal planner and a random agent. (b) Planning time in seconds as the interval between visual mini-block onset and execution of first action. (c) Planning depth: Inferred mean number of planning steps that were considered in the action plan when first action was executed. (d) Beta (formula image: Inverse decision temperature (decision noise), larger values indicate a lower decision noise. (e) Theta (formula image): Action bias, negative values indicate a bias towards move action. (f) Kappa (formula image): Hyperbolic discounting parameter, larger values indicate a stronger discounting of rewards reached by a probabilistic jump transition. Error bars indicate standard error of the mean. Note that the error bars are very small in (b) and (c).

Similar articles

References

    1. Sutton, R. S. & Barto, A. G. Reinforcement Learning: An Introduction (The MIT Press, 2018).
    1. Mattar, M. G. & Lengyel, M. Planning in the brain. Neuron110, 914–934 (2022). - PubMed
    1. Gigerenzer, G. & Gaissmaier, W. Heuristic decision making. Annu. Rev. Psychol.62, 451–482 (2011). - PubMed
    1. Callaway, F., Lieder, F., Krueger, P. & Griffiths, T. L. Mouselab-MDP: A new paradigm for tracing how people plan. (2017).
    1. Huys, Q. J. M. et al. Bonsai trees in your head: How the Pavlovian system sculpts goal-directed choices by pruning decision trees. PLoS Comput. Biol.8, e1002410 (2012). - PMC - PubMed

LinkOut - more resources