. 2025 May 9;5(1):163.
doi: 10.1038/s43856-025-00829-3.

Impact of COVID-19 vaccination on symptoms and immune phenotypes in vaccine-naïve individuals with Long COVID

Affiliations

Impact of COVID-19 vaccination on symptoms and immune phenotypes in vaccine-naïve individuals with Long COVID

Connor B Grady et al. Commun Med (Lond). .

Abstract

Background: The symptomatic and immune responses to COVID-19 vaccination of people with Long COVID are poorly characterized.

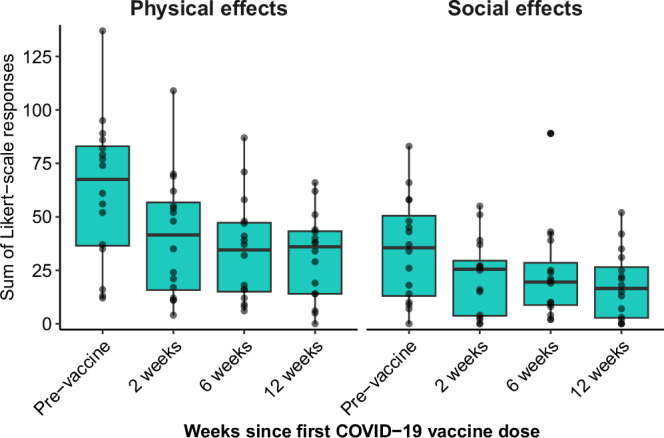
Methods: In this prospective study, we evaluated changes in symptoms and immune responses after COVID-19 vaccination in 16 vaccine-naïve individuals with Long COVID. Surveys were administered before vaccination and at 2, 6, and 12 weeks after receiving the first vaccine dose of the primary series. Simultaneously, SARS-CoV-2-reactive TCR enrichment, SARS-CoV-2-specific antibody responses, antibody responses to other viral and self-antigens, and circulating cytokines were quantified before vaccination and at 6 and 12 weeks after vaccination.

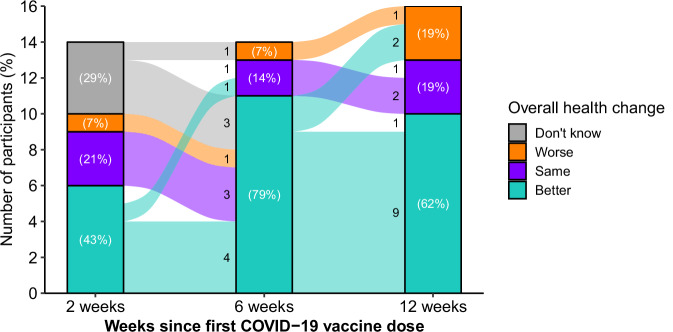
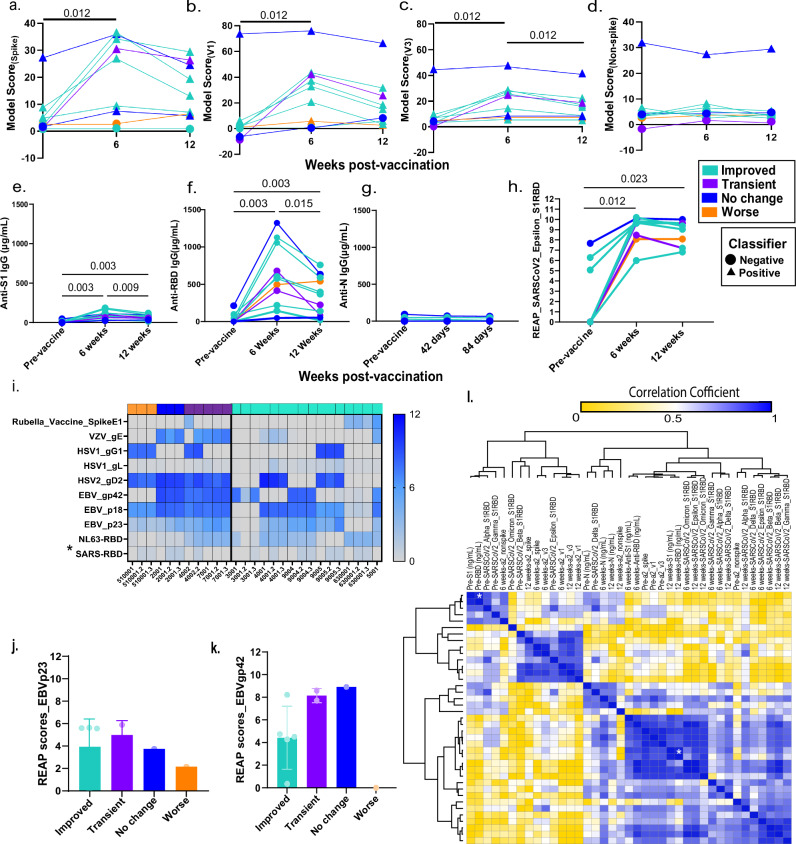
Results: At 12 weeks post-vaccination, self-reported improved health is seen in 10 out of 16 participants, 3 have no change, and 3 have worse health although 2 report transient improvement after vaccination. One participant reporting worse health was hospitalized twice with chest pain (after each dose). Symptom outcomes are most associated with plasma biosignatures. Higher baseline sIL-6R is associated with symptom improvement, and stably elevated levels of IFN-β and CNTF are associated with no improvement. Significant elevation in SARS-CoV-2-specific TCRs and spike protein-specific IgG are observed at 6 and 12 weeks after vaccination. No changes in reactivities are observed against herpes viruses and self-antigens.

Conclusions: In this study of 16 people with Long COVID, vaccination is associated with increased SARS-CoV-2 spike protein-specific IgG and T cell expansion in most participants. Specific immune features are associated with symptom change after vaccination and most participants experience improved health or no change following vaccination.

Plain language summary

The impact of the COVID-19 vaccine on unvaccinated individuals suffering from Long COVID is uncertain. This study assessed the experience and biological markers of 16 unvaccinated participants with Long COVID. A total of 10 participants had improved health after vaccination, three reported worsening health, with one hospitalized twice with chest pain. Vaccination boosted the body’s immune responses against the virus that causes COVID-19. We identified biological markers that correlate with the changes in overall health after vaccination. Given that the study was small, more research is needed to confirm these results.


Conflict of interest statement

Competing interests: In the past three years, H.M.K. received expenses and/or personal fees from United Health, Element Science, Eyedentifeye and F-Prime; he is a co-founder of Refactor Health and HugoHealth; and is associated with contracts, through Yale New Haven Hospital, from the Centers for Medicare & Medicaid Services and through Yale University from the Food and Drug Administration, Johnson & Johnson, Google and Pfizer. A.I. co-founded and consults for RIGImmune, Xanadu Bio and PanV and is a member of the Board of Directors of Roche Holding and Genentech. No other authors declare competing interests.

Figures

Fig. 1
Fig. 1. Overall health change since receiving first dose of COVID-19 vaccine, measured with surveys sent 2, 6, and 12 weeks after vaccination.
Participants were asked “Would you say that your overall health, as compared to your health before the vaccine, is worse, better, or the same?” at each post-vaccination survey. Data missing for n = 2 at 2 weeks and n = 2 at 6 weeks.
Fig. 2
Fig. 2. Distribution of the sum of participants’ responses to two measures of symptom severity—physical and social effects—measured before vaccination and surveys sent 2, 6, and 12 weeks after vaccination.
To measure physical effect of each symptom from a list of 125 symptoms, participants were asked, “While experiencing these symptoms, how much do/did they bother you in terms of discomfort or pain?” Similarly, to measure social effects, participants were asked, “After quarantine, how much does/did the symptom impair your social or family functioning compared to pre-COVID? Responses for each symptom were scored 0–4 (Supplementary Table 1) and summed for each participant. Boxplots show the distribution of responses, with points indicating the score for each participant; the central lines indicate the group median values, the top and bottom lines indicate the 75th and 25th percentiles, respectively, the whiskers represent 1.5× the interquartile range. Higher values suggest a greater symptom burden, and a value of 0 suggests no symptom burden Data missing for n = 2 at 2 weeks and n = 2 at 6 weeks.
Fig. 3
Fig. 3. Vaccination resulted in increase in SARS-CoV-2 T-cell repertoires and specific humoral responses among Long COVID participants.
a Model scores and binary classifications are plotted against days post-vaccination using spike viral protein specific classifier, b COVID classifier version 1 (v1), c COVID classifier version 3 (v3), d Non-spike-specific protein classifier, e Line plots of matched anti-SARS-CoV-2 S1 IgG concentrations before, 6 and 12 weeks post-vaccination in Long COVID participants, f Line plots of matched anti-SARS-CoV-2 RBD IgG concentrations before, 6 and 12 weeks post-vaccination in Long COVID participants, g Line plots of matched anti-SARS-CoV-2 N IgG concentrations before, 6 and 12 weeks post-vaccination in Long COVID participants. The color codes denote the reported health status at 6 and 12 weeks post-vaccination, better at both timepoints [teal], no change at both timepoints [blue], better at 6 weeks and worse at 12 weeks, [purple] & worse at both timepoints [orange], h Line plots of matched anti-SARS-CoV-2 Epsilon variant reactivity scores against the Spike protein assessed by Rapid Extracellular Antigen Profiling (REAP), i Heatmap of REAP reactivities against 10 viral proteins namely, proteins belonging to common viral pathogens from Coronaviridae (human SARS-CoV-1 viruses), Herpesviridae families, and the Rubella vaccine protein. Each protein and each participant timepoint are represented as a row and a column respectively. The participant IDs are mentioned below each column and the numbers after decimal denote the collection timepoints after vaccination (6 weeks = 2; 12 weeks = 3). Statistical significance determined by Wilcoxon Rank tests and corrected for multiple testing using the Bonferroni method, j EBV p23 REAP scores among outcome groups. Significance was assessed using Kruskal–Wallis tests, k EBV gp42 REAP scores among outcome groups, l Hierarchical clustering of Spearman Rank correlation coefficients of TCR model scores, antibody concentrations and REAP scores at all three timepoints. Only adjusted p-values of <0.05 are mentioned in line plots and denoted by asterisks in heatmaps.
Fig. 4
Fig. 4. Elevated interferon and neuropeptide signaling is associated with poor recovery post-vaccination.
a Unsupervised hierarchical clustering of plasma-derived analyte expression within the cohort for all three sample timepoints (pre-vaccination, 6 weeks post series completion, and 12 weeks post series completion). Color panel above heatmap shows the symptom outcome subgroup of each individual as indicated by the key. Samples for each individual are labeled by their sample code LC.R.HK.1.00XX.tX, where XX designates the patient ID and tX designates the timepoint (t1 = pre vaccination, t2 = 6 weeks post series completion, and t3 = 12 weeks post series completion). Sample label color indicates further categorization into Same/Worse (orange), Transient improvement (i.e., better then worse; purple), and Improved (teal). Color scale is magma and is normalized for each analyte (data table columns) with darker colors indicating higher relative expression and lighter colors indicating lower expression as shown by the key. b Expression Heatmap of significant differentially expressed factors between symptom outcome groups (Same/Worse, Transient, and Improved), as labeled. Each subgroup is further separated by the vaccine timepoint. Each factor was centered and standardized to generate a z-score and colors are representative of expression as indicated by the legend (positive z-scores in red; negative z-scores in blue). To show significance between groups, samples were organized with outer brackets of the heatmap indicating the symptom outcome group demonstrating significantly lower expression and inner brackets indicating the comparator group from which significance is derived. Significance was determined using linear mixed models (LMM) via restricted maximum likelihood (REML) regression for log-transformed values, accounting for repeated measures across individuals over time as described in the methods and adjusted for multiple comparisons within each parameter using the Tukey method. ch Example differentially expressed factors between symptom outcome groups as determined by LMM, previously described. i Top 20 bootstrapped predictors of symptom outcome (unimproved vs improved), determined by Partial Least Squares (PLS) optimized at eight components. Predictors are ordered by importance with highest importance on the left. Color and direction of each bar represents the relative regression association to unimproved individuals with positive values showing a positive association (red) and negative values showing a negative association (blue). Color is determined by regression as shown. Details of NIPALS and detailed results can be found in the methods and in extended data, respectively.

Update of

References

    1. Iacobucci, G. Long covid: Damage to multiple organs presents in young, low risk patients. BMJ m4470, 10.1136/bmj.m4470 (2020).
    1. Huang, Y. et al. COVID Symptoms, Symptom Clusters, and Predictors for Becoming a Long-Hauler Looking for Clarity in the Haze of the Pandemic. Clin. Nurs. Res.31, 1390–1398 (2022). - PMC - PubMed
    1. Nehme, M. et al. COVID-19 Symptoms: Longitudinal Evolution and Persistence in Outpatient Settings. Ann. Intern. Med.174, 723–725 (2021). - PMC - PubMed
    1. O’Mahoney, L. L. et al. The prevalence and long-term health effects of Long Covid among hospitalised and non-hospitalised populations: a systematic review and meta-analysis. eClinicalMedicine55, 101762 (2023). - PMC - PubMed
    1. Greenhalgh, T., Knight, M., A’Court, C., Buxton, M. & Husain, L. Management of post-acute covid-19 in primary care. BMJ370, m3026 (2020). - PubMed

LinkOut - more resources