. 2025 May 9;16(1):713.
doi: 10.1007/s12672-025-02520-4.

Identification of programmed cell death-related genes and construction of a prognostic model in oral squamous cell carcinoma using single-cell and transcriptome analysis

Affiliations

Identification of programmed cell death-related genes and construction of a prognostic model in oral squamous cell carcinoma using single-cell and transcriptome analysis

Yongheng Li et al. Discov Oncol. .

Abstract

Background: Oral squamous cell carcinoma (OSCC) is characterized by poor prognosis and high mortality. Understanding programmed cell death-related genes could provide valuable insights into disease progression and treatment strategies.

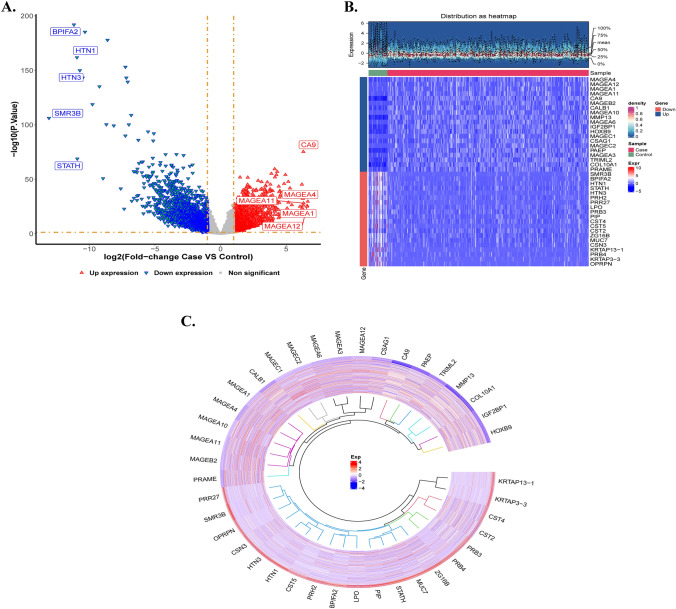
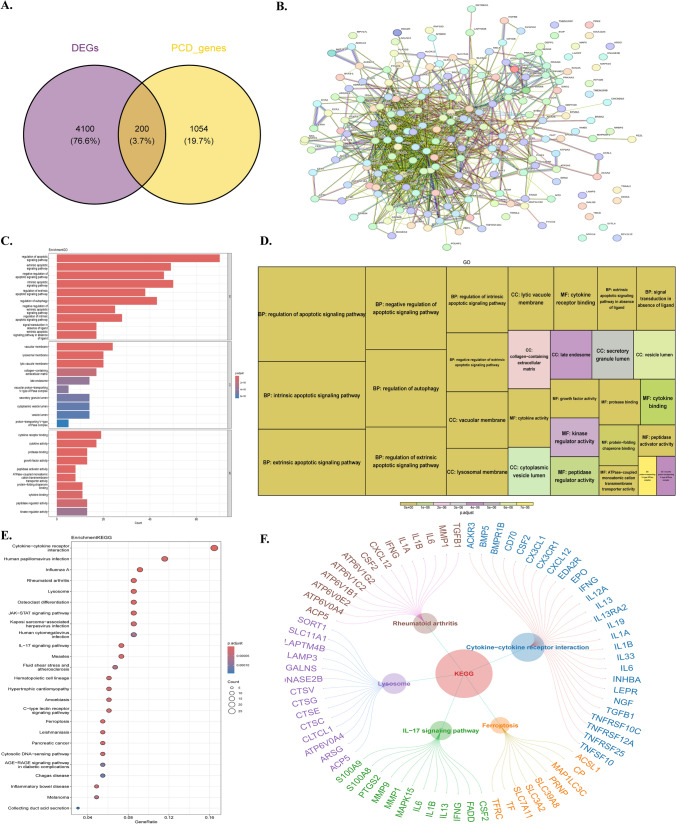
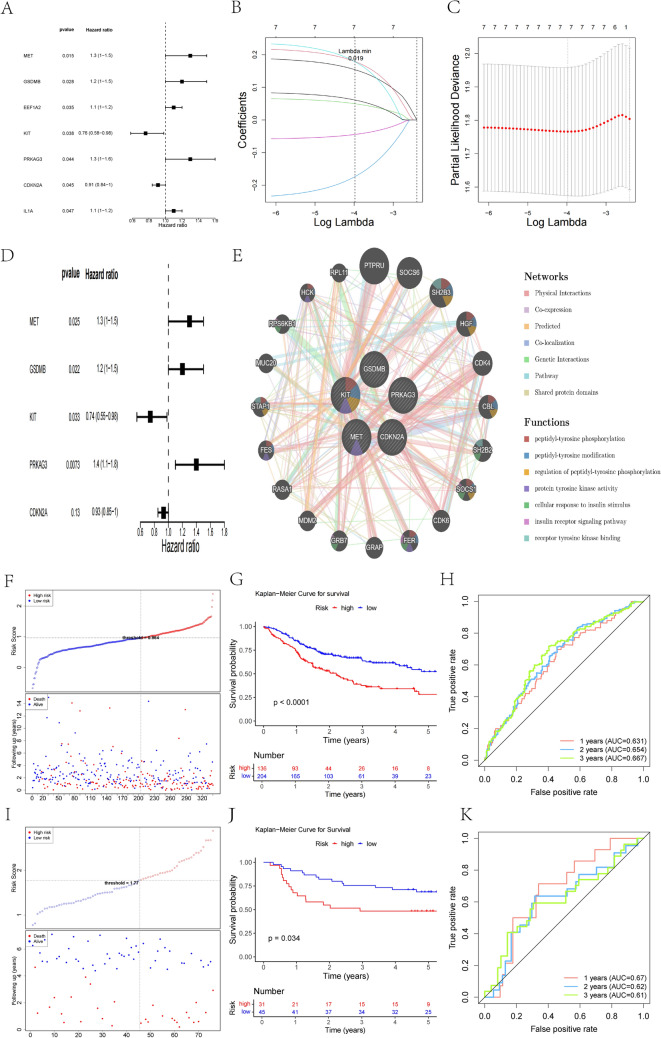
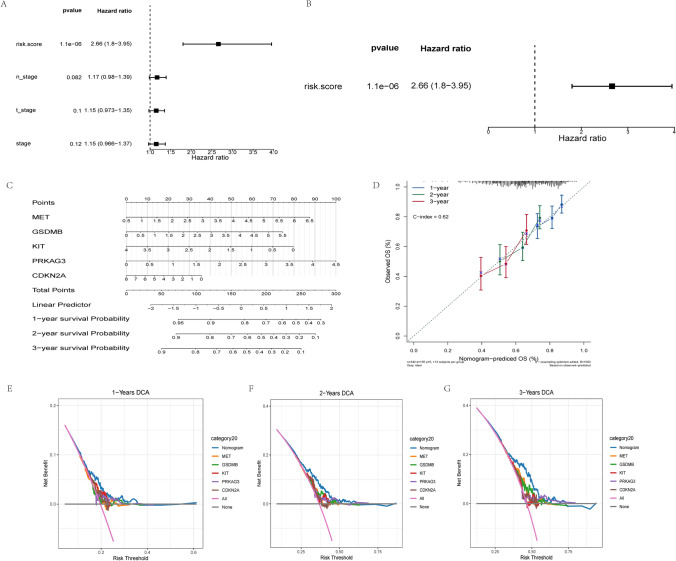
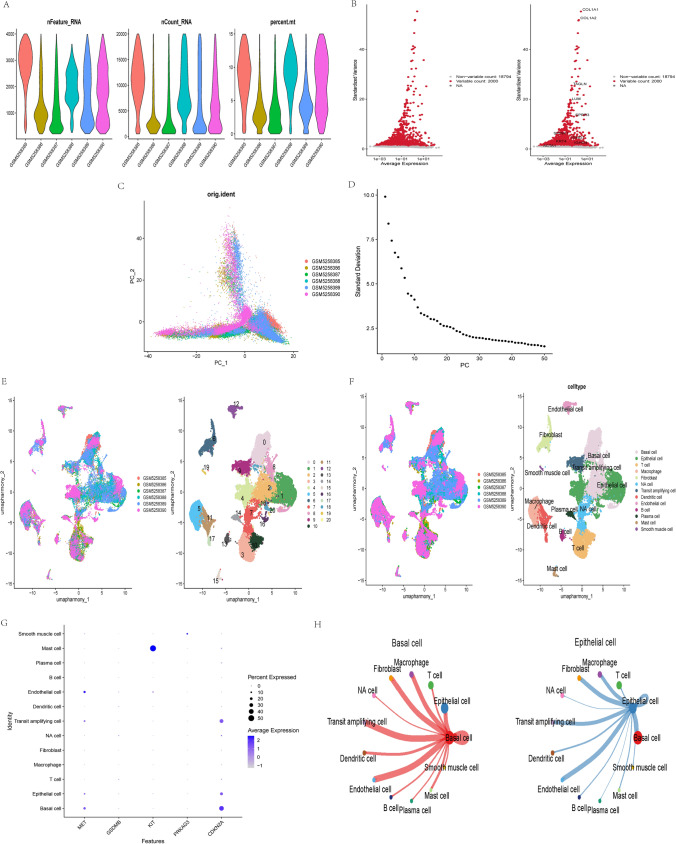
Methods: RNA-sequencing data from 341 OSCC tumor tissues and 31 healthy samples were analyzed from TCGA database, with validation using 76 samples from GSE41613. Single-cell RNA sequencing data was obtained from GSE172577 (6 OSCC samples). Differentially expressed genes (DEGs) were identified and intersected with 1,254 programmed cell death-related genes. A protein-protein interaction network was constructed, and key modules were identified. Univariate Cox, LASSO, and multivariate Cox regression analyses were performed to build a prognostic model. Model performance was evaluated using Kaplan-Meier analysis, ROC curves, and nomogram validation.

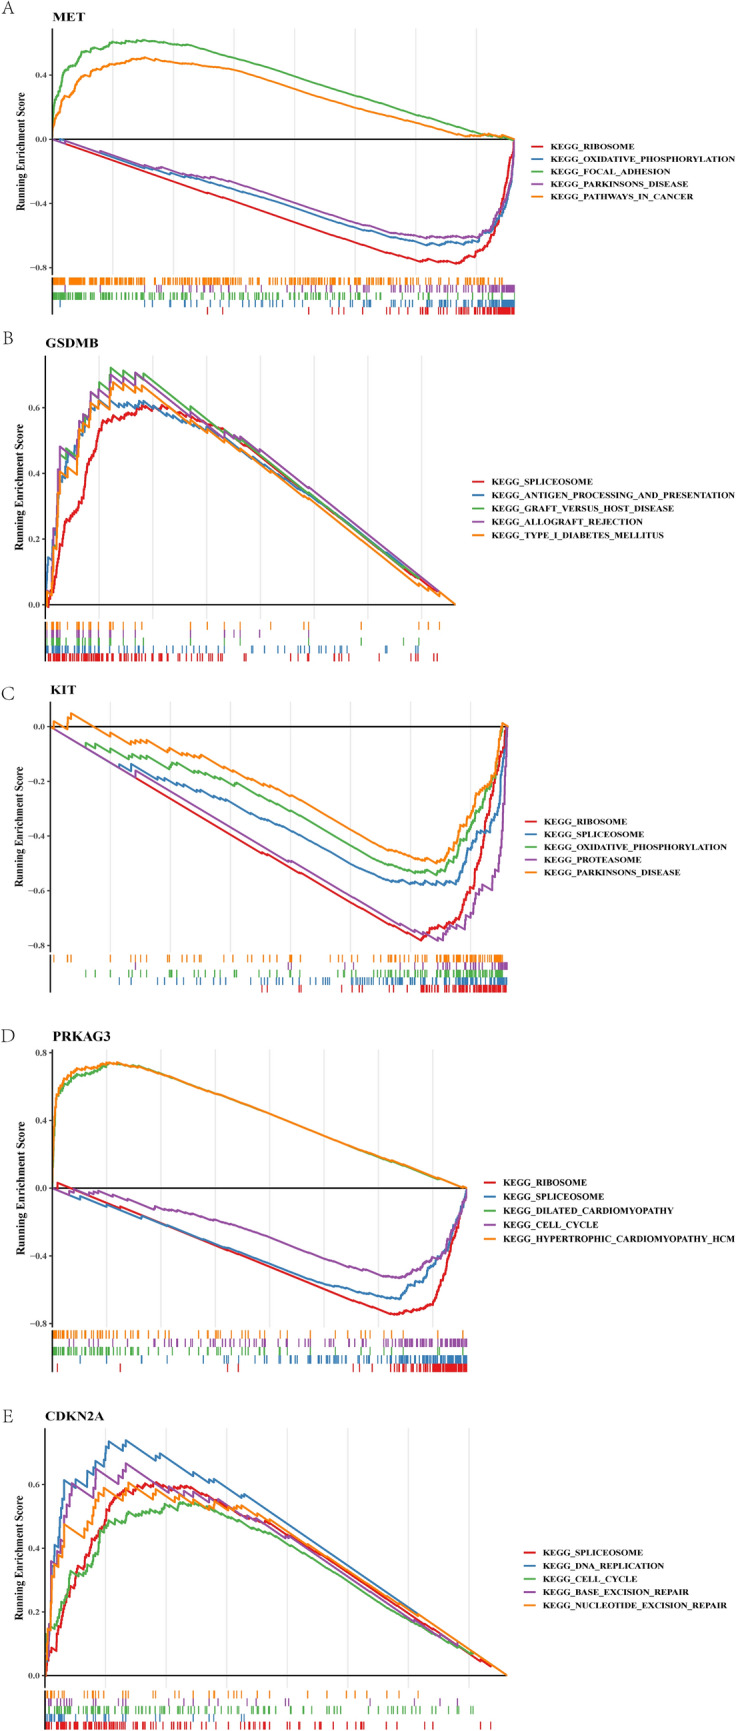
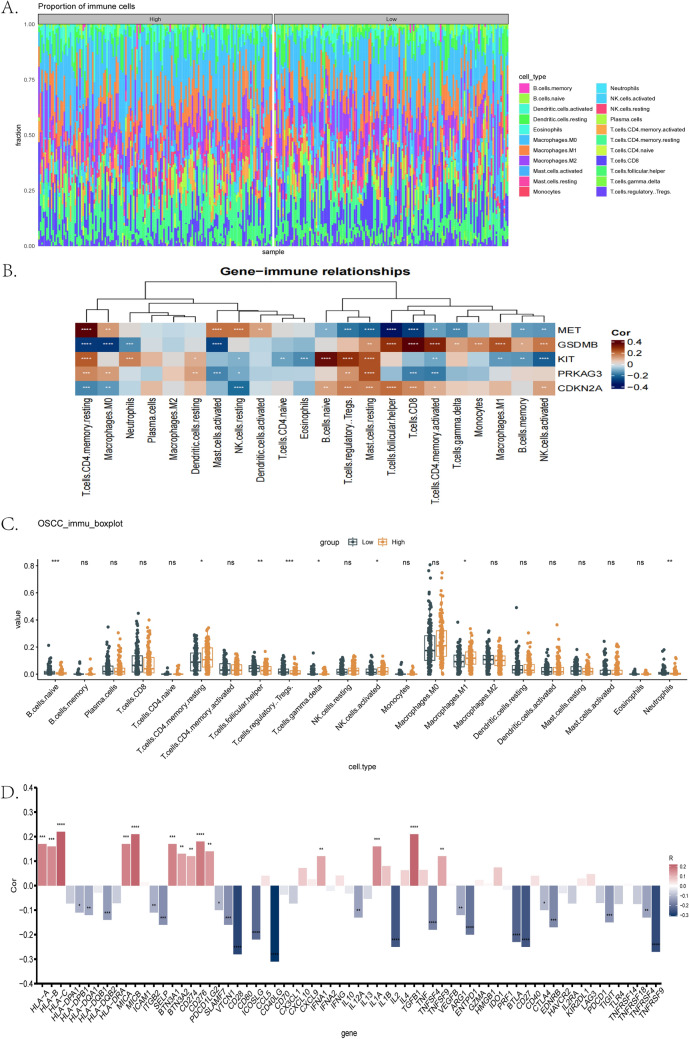
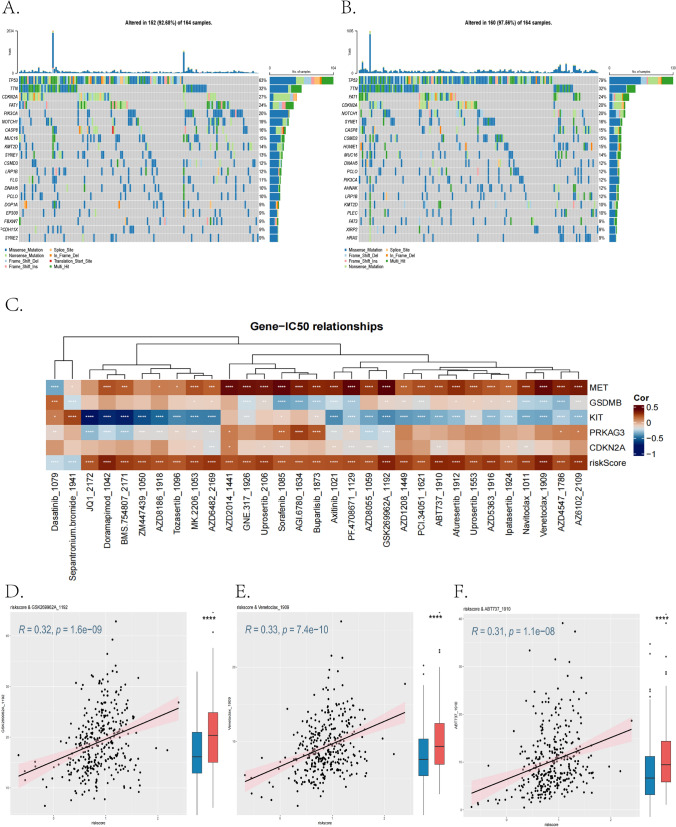
Results: The study identified 200 candidate genes from the intersection of DEGs and programmed cell death-related genes, which were further refined to 57 hub genes through PPI network analysis. A prognostic signature consisting of five genes (MET, GSDMB, KIT, PRKAG3, and CDKN2A) was established and validated. The model demonstrated good predictive performance in both training and validation cohorts (AUC > 0.6 for 1-, 2-, and 3-year survival). Single-cell analysis revealed that prognostic genes were predominantly expressed in stromal and epithelial cells. Cell communication analysis indicated strong interactions between stromal and epithelial cells.

Conclusions: This study developed and validated a novel five-gene prognostic signature for OSCC based on programmed cell death-related genes. The model shows promising clinical application potential for risk stratification and personalized treatment of OSCC patients.

Keywords: Oral squamous cell carcinoma; Prognostic model; Programmed cell death; Single-cell RNA sequencing; Tumor microenvironment.


Conflict of interest statement

Declarations. Ethics approval: Not applicable. Competing interests: The authors declare no competing interests.

Figures

Fig. 1
Fig. 1
Differential gene expression analysis in OSCC and normal tissues. A Volcano plot showing differentially expressed genes between OSCC and normal tissues. Red dots represent upregulated genes and blue dots represent downregulated genes (|log2 FC| ≥ 1, p < 0.05). B Heatmap showing the hierarchical clustering of differentially expressed genes. C Circular visualization of top differential genes’ expression patterns across all samples
Fig. 2
Fig. 2
Identification and functional enrichment analysis of candidate genes. A Venn diagram showing the overlap between DEGs and PCD-related genes. B Protein–protein interaction network of candidate genes. C Bar plot of GO enrichment analysis for biological process, cellular component and molecular function. D Treemap visualization of GO enrichment results. E Bubble plot showing KEGG pathway enrichment analysis. F Circular network diagram illustrating relationships between genes and enriched KEGG pathways
Fig. 3
Fig. 3
Construction and validation of the programmed cell death-related prognostic model for OSCC. A Forest plot of univariate Cox regression analysis identifying survival-associated genes (p < 0.05). B LASSO coefficient profiles of the candidate prognostic genes. Each curve represents a gene, with coefficient values changing along the log(lambda) parameter. C Cross-validation plot for selecting the optimal lambda value in LASSO regression. D Forest plot of multivariate Cox regression analysis showing the five independent prognostic genes (MET, GSDMB, KIT, PRKAG3, and CDKN2 A) with their respective hazard ratios and 95% confidence intervals. E Gene–gene interaction network showing the functional associations between the five prognostic genes and their top interacting partners. F Risk score distribution (upper panel) and patient survival status (lower panel) in the TCGA training cohort. Patients are arranged by increasing risk score from left to right. G Kaplan–Meier survival curve comparing high- and low-risk groups in the TCGA training cohort (p < 0.0001). H Time-dependent ROC curves showing the predictive performance of the risk model for 1-, 2-, and 3-year survival in the TCGA training cohort (AUC = 0.631–0.667). I Risk score distribution (upper panel) and patient survival status (lower panel) in the GSE41613 validation cohort. J Kaplan–Meier survival curve comparing high- and low-risk groups in the GSE41613 validation cohort (p = 0.034). K Time-dependent ROC curves showing the predictive performance of the risk model for 1-, 2-, and 3-year survival in the GSE41613 validation cohort (AUC = 0.61–0.67)
Fig. 4
Fig. 4
Development and validation of the prognostic nomogram. A, B Univariate and multivariate Cox regression analyses of clinical features and risk score. C Nomogram for predicting 1-, 2-, and 3-year overall survival. D Calibration curves for nomogram predictions. EG Decision curve analysis showing clinical benefit of the nomogram at 1-, 2-, and 3-year time points
Fig. 5
Fig. 5
GSEA pathway analysis of prognostic genes. AE Gene Set Enrichment Analysis (GSEA) showing significantly enriched pathways for each prognostic gene: A MET, B GSDMB, C KIT, D PRKAG3, and E CDKN2 A. Running enrichment scores and gene set member positions are shown for each pathway
Fig. 6
Fig. 6
Analysis of immune cell infiltration in OSCC. A Box plots showing the distribution of 22 immune cell types between high- and low-risk groups. B Stacked bar plot showing the proportion of immune cells in each sample. C Heatmap showing correlations between prognostic genes and immune cell types. D Bar chart showing correlations between risk scores and immune-regulatory genes. Asterisks indicate statistical significance (*p < 0.05, **p < 0.01, ***p < 0.001)
Fig. 7
Fig. 7
Single-cell RNA sequencing analysis of OSCC samples. A Quality control metrics showing nFeature_RNA, nCount_RNA, and percent.mt distributions. B Variable gene analysis plot. C PCA plot colored by sample origin. D PCA elbow plot. EF UMAP visualization colored by sample origin and unsupervised clustering. G Expression patterns of prognostic genes across cell types. H Cell–cell communication network analysis showing interaction patterns between different cell types
Fig. 8
Fig. 8
Somatic mutation profiles and drug sensitivity analysis in OSCC. A Oncoplot showing the mutation landscape in the low-risk group. B Oncoplot showing the mutation landscape in the high-risk group. C Heatmap showing correlations between risk scores and IC50 values of multiple drugs, with color intensity indicating correlation strength. DF Correlation analyses between risk scores and sensitivity to three key drugs: D GSK2699G2 A_1192, E Venetoclax_1909, and F ABT737_1910. Each panel includes both a scatter plot showing the relationship between risk score and IC50 values (with high-risk patients in red and low-risk patients in blue) and a box plot comparing IC50 distributions between risk groups. Asterisks indicate statistical significance (*p < 0.05, **p < 0.01, ***p < 0.001)

Similar articles

References

    1. Wei S, Han C, Mo S, Huang H, Luo X. Advancements in programmed cell death research in antitumor therapy: a comprehensive overview. Apoptosis. 2025;30(1):401–21. - PubMed
    1. Shao S-H, Qiu S-T, Li Y, Zhang Y-Y, Cao Y-J, DI C-H, et al. Ferroptosis: mechanisms and application in tumor treatment. Zhongguo yi xue ke xue yuan xue bao Acta Academiae Medicinae Sinicae. 2024;46(5):732–9. - PubMed
    1. Fei C, Zhen X, Shiqiang Z, Jun P. Frontier knowledge and future directions of programmed cell death in clear cell renal cell carcinoma. Cell Death Discov. 2024;10(1):113. - PMC - PubMed
    1. Newton K, Strasser A, Kayagaki N, Dixit VM. Cell death. Cell. 2024;187(2):235–56. - PubMed
    1. Liu J, Hong M, Li Y, Chen D, Wu Y, Hu Y. Programmed cell death tunes tumor immunity. Front Immunol. 2022;13:847345. - PMC - PubMed

LinkOut - more resources