Identification and construction of a novel NET-related gene signature for predicting prognosis in multiple myeloma
- PMID: 40346405
- PMCID: PMC12064474
- DOI: 10.1007/s10238-025-01692-1
Identification and construction of a novel NET-related gene signature for predicting prognosis in multiple myeloma
Abstract
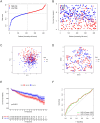
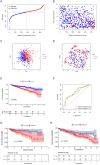
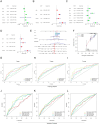
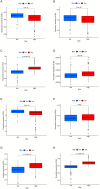
Neutrophil extracellular traps are essential in the development and advancement of multiple myeloma (MM). However, research investigating the prognostic value with NET-related genes (NRGs) in MM has been limited. Patient transcriptomic and clinical information was sourced from the gene expression omnibus database. Cox regression analysis with a univariate approach was employed to explore the link between NRGs and overall survival (OS). Kaplan-Meier methods were applied to assess variations in survival rates. A nomogram integrating clinical data and predictive risk metrics was crafted using multivariate logistic and Cox proportional risk model regression analyses. Additionally, we investigated the disparities in biological pathways, drug sensitivity, and immune cell involvement, and validated differential levels of two key genes through qPCR. We identified 148 differentially expressed NRGs through published articles, of which 14 were associated with prognosis in MM. Least absolute shrinkage and selection operator Cox regression model established a nine-gene NRG signature-comprising ANXA1, ANXA2, ENO1, HIF1A, HSPE1, LYZ, MCOLN3, THBD, and FN1-that demonstrated strong predictive power for patient survival. The Cox regression model with multiple variables demonstrated that the risk score independently predicted OS, showing that those with a high score had worse survival rates. Furthermore, a nomogram incorporating patient age, LDH levels, the International Staging System, and NRGs was developed, demonstrating strong prognostic prediction capabilities. Drug sensitivity correlation analysis also offered valuable guidance for future immuno-oncological therapies and drug selection in MM patients. The NRGs signature was a reliable biomarker for MM, effectively identifying high-risk patients and forecasting clinical outcomes.
Keywords: Multiple myeloma; Neutrophil extracellular traps; Prognostic signature; Tumor prognostic biomarkers.
© 2025. The Author(s).
Conflict of interest statement
Declarations. Competing interests: The authors declare no competing interests. Ethics approval and consent to participate. This study was approved by the Ethics Committee of the Second Affiliated Hospital of Anhui Medical University, and informed consent was obtained from all patients. All experiments were conducted by relevant guidelines and regulations.
Figures


Similar articles
-
A novel NET-related gene signature for predicting DLBCL prognosis.J Transl Med. 2023 Sep 16;21(1):630. doi: 10.1186/s12967-023-04494-9. J Transl Med. 2023. PMID: 37716978 Free PMC article.
-
Identification of a novel lactylation-related gene signature predicts the prognosis of multiple myeloma and experiment verification.Sci Rep. 2024 Jul 2;14(1):15142. doi: 10.1038/s41598-024-65937-x. Sci Rep. 2024. PMID: 38956267 Free PMC article.
-
NET-related gene signature for predicting AML prognosis.Sci Rep. 2024 Apr 20;14(1):9115. doi: 10.1038/s41598-024-59464-y. Sci Rep. 2024. PMID: 38643300 Free PMC article.
-
Identification of a novel PANoptosis-related gene signature for predicting the prognosis in clear cell renal cell carcinoma.Medicine (Baltimore). 2024 Sep 27;103(39):e39874. doi: 10.1097/MD.0000000000039874. Medicine (Baltimore). 2024. PMID: 39331898 Free PMC article.
-
Construction of a novel mRNA-signature prediction model for prognosis of bladder cancer based on a statistical analysis.BMC Cancer. 2021 Jul 27;21(1):858. doi: 10.1186/s12885-021-08611-z. BMC Cancer. 2021. PMID: 34315402 Free PMC article.
References
-
- Dimopoulos MA, Moreau P, Terpos E, et al. Multiple myeloma: EHA-ESMO clinical practice guidelines for diagnosis, treatment and follow-up(†). Ann Oncol. 2021;32:309–22. - PubMed
-
- Durie BG, Salmon SE. A clinical staging system for multiple myeloma. Correlation of measured myeloma cell mass with presenting clinical features, response to treatment, and survival. Cancer. 1975;36:842–54. - PubMed
-
- Pawlyn C, Morgan GJ. Evolutionary biology of high-risk multiple myeloma. Nat Rev Cancer. 2017;17:543–56. - PubMed
-
- Kastritis E, Terpos E, Dimopoulos MA. How I treat relapsed multiple myeloma. Blood. 2022;139:2904–17. - PubMed
MeSH terms
Substances
Grants and funding
LinkOut - more resources
Full Text Sources
Medical
Research Materials
Miscellaneous

