

Does capitation payment influence healthcare service behavior in county medical community? Evidence from patients with diabetes in rural China
- PMID: 40346503
- PMCID: PMC12063278
- DOI: 10.1186/s12889-025-22979-8
Does capitation payment influence healthcare service behavior in county medical community? Evidence from patients with diabetes in rural China
Abstract
Objective: Amid efforts to develop primary healthcare, China has been working to establish an integrated care system through the county medical community model, incorporating capitation payment to improve chronic disease management. This study investigates the impact of capitation payment reform on diabetes-related healthcare service behaviors across different levels of healthcare facilities within the county medical community.
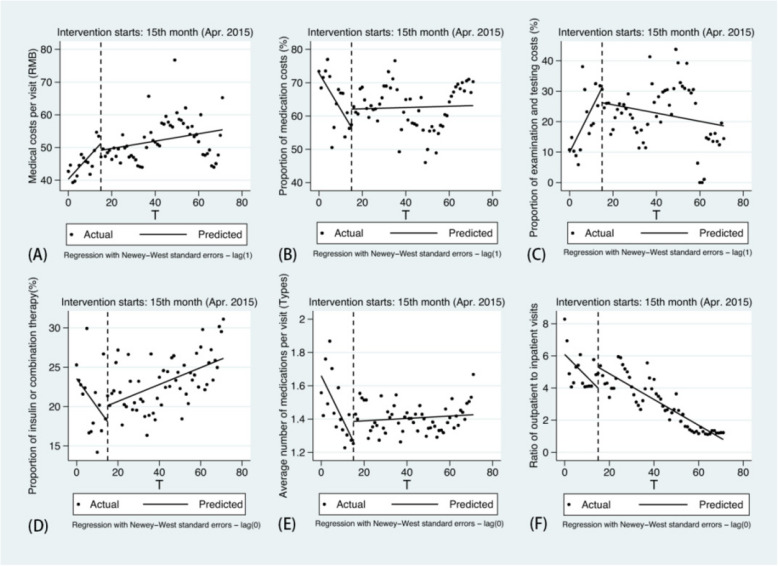
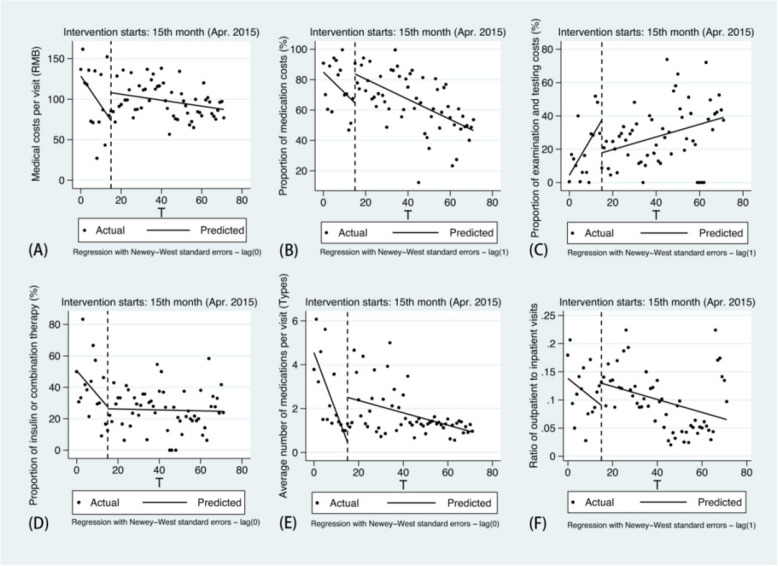
Methods: We conducted interrupted time series analysis to evaluate the changes in healthcare service behavior before and after the implementation of the capitation model. Using F County, as the sample area, we collected outpatient reimbursement records of type 2 diabetes mellitus (T2DM) patients from six townships that initiated reform in April 2015. The dataset, covering January 2014 to December 2019, includes 49,326 records from primary healthcare facilities and 1,628 from county hospitals, with information on medical costs, service items, and other details.
Results: Following the implementation of capitation, both the average medical costs per visit and proportion of examination and testing costs showed a deceleration in growth in primary healthcare facilities (-0.615, p < 0.05; -1.554, p < 0.01). The proportion of medication costs, the proportion of insulin or combination therapy and the average number of medications exhibited a significant downward trend prior to the reform, while all reversed to upward trends after reform. In county hospitals, the proportion of medication costs increased by 19.115% immediately post-reform, and both the level and slope of average number of medications significantly rose (2.041, p < 0.01; 0.244, p < 0.01). Although the proportion of examination and testing costs increased before the reform, both the instantaneous level and the trend declined afterward (-19.684, p < 0.05; -1.833, p < 0.05).
Conclusions: In the sample area, the average medical costs for T2DM outpatients were effectively controlled after the capitation reform. Township health centers showed improved standardization in prescribing practices, while county hospitals focused more on comprehensive examinations and testing services. Medication prescription intensity increased across all facilities, contributing to enhanced chronic disease management.
Keywords: Capitation; County medical community; Healthcare service behavior; Interrupted time series; Type 2 diabetes mellitus.
© 2025. The Author(s).
Conflict of interest statement
Declarations. Ethics approval and consent to participate: We confirm that all procedures were conducted adherence to the Declaration of Helsinki. Informed consent was obtained from all participants and/or their legal guardians. This study was approved by the Medical Ethics Committee of Capital Medical University. Consent for publication: Not applicable. Competing interests: The authors declare no competing interests.
Figures
References
-
- Wei L. Continuity—fragmentation—integration: historical review of health service delivery modes from three-level health service networks in rural China [in Chinese]. Chin J Health Policy. 2014;7(12):24–30.
-
- General Office of the State Council. Guiding opinions on promoting the construction of hierarchical diagnosis and treatment system. Beijing: Government of China; 2015. https://www.gov.cn/zhengce/content/2015-09/11/content_10158.htm.
MeSH terms
Grants and funding
LinkOut - more resources
Full Text Sources
Medical
Miscellaneous
